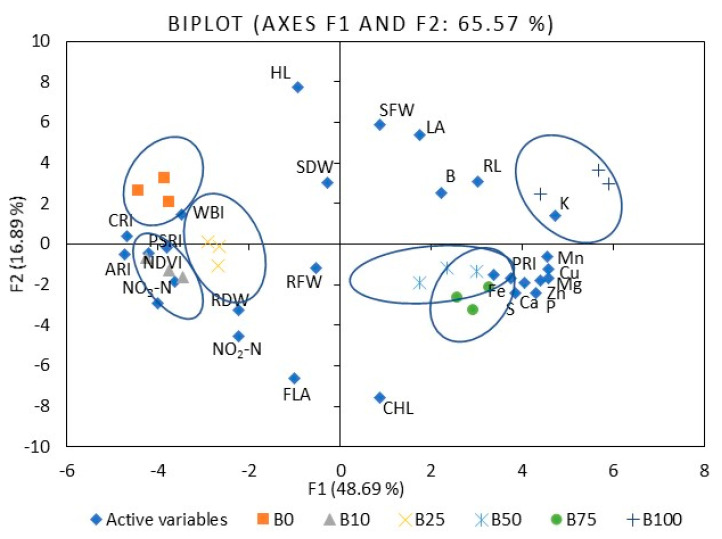
Figure 3.
The PCA scatter plots, indicating distinct differences in the investigated parameters of mustard microgreens. B0R100, B10R90, B25R75 B50R50, B75R25, and B100R0: indicate the percentage of blue (B) and red (R) light.HL: hypocotyl length, RL: root length, LA: leaf area, SFW: shoot fresh weight, SDW: shoot dry weight, RFW: root fresh weight, RDW: root dry weight, P: phosphorus, K: potassium, Ca: calcium, Mg: magnesium, S: sulfur, Fe: iron, Zn: zinc, Mn: manganese, Cu: copper, B: boron, NO3-N: nitrates, NO2-N: nitrites, CHL: chlorophyll index, FLA: flavonoid index, ARI1: anthocyanin reflectance index, CRI2: carotenoid reflectance index, NDVI: normalized difference vegetation index, PRI: photochemical reflectance index, PSRI: plant senescence reflectance index, WBI: water band index. The significance level was set at p ≤ 0.05.

