Figure 1.
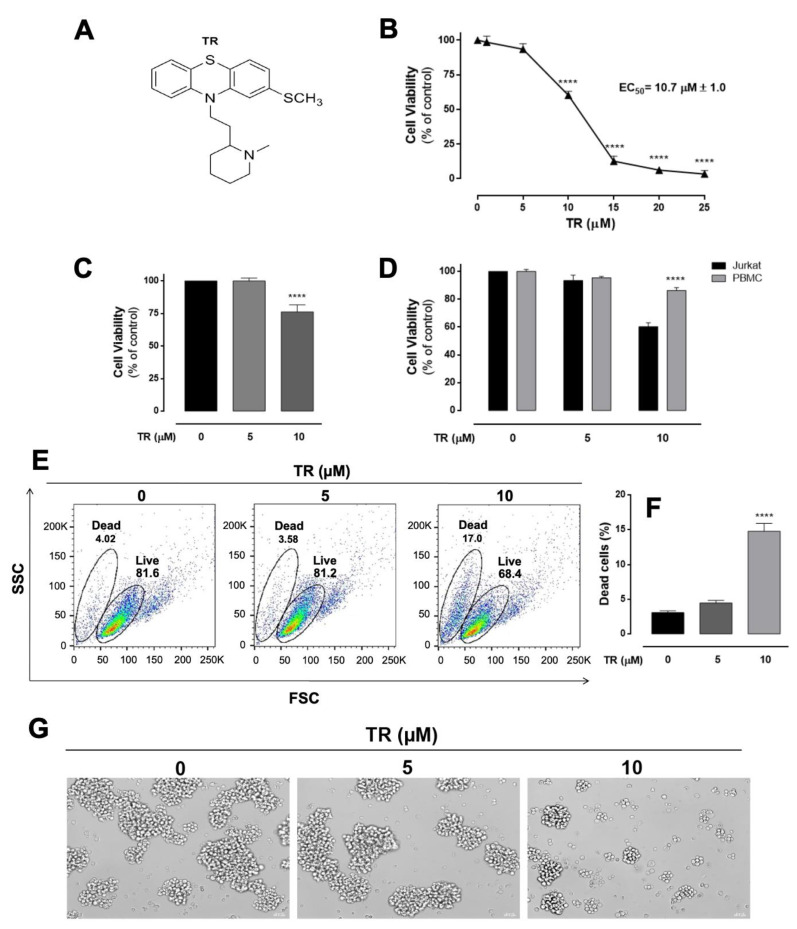
Enhancement of the cytotoxicity of TR and selectivity against human leukemia Jurkat cells compared to human normal blood cells. (A) Molecular structure of the thioridazine. (B) Cell viability was assessed by the MTT reduction test. Cells were incubated with increasing TR concentrations (0–25 µM) for 24 h. The EC50 value for TR was calculated as 10.7 μM. (C) Cell viability was also assessed by the trypan blue exclusion assay. **** (p < 0.0001) indicates a difference from control (absence of the drug). (D) Cell viability assessed by MTT reduction test in normal and leukemia cells obtained with 5 and 10 µM TR. The human peripheral blood mononuclear cells (PBMC) were stimulated with 5 µg/mL phytohemagglutinin. The percentage of viable cells was calculated in relation to control (untreated), considered as 100%. The results are presented as the mean ± SEM of at least three independent experiments performed in triplicate. **** Statistically different from Jurkat cells (p < 0.0001). (E) Changes in cell size and granularity (FSC × SSC parameters). Representative dot plots of at least three independent experiments performed in duplicate. (F) Quantification of dead cells based on FSC and SSC parameters. The results are presented as the mean ± SEM of at least three independent experiments performed in duplicate. **** (p < 0.0001) indicates a difference from control (absence of the drug). (G) Morphological alterations of Jurkat cells assessed by optical microscopy (400× magnification, scale bar 20 µM).

