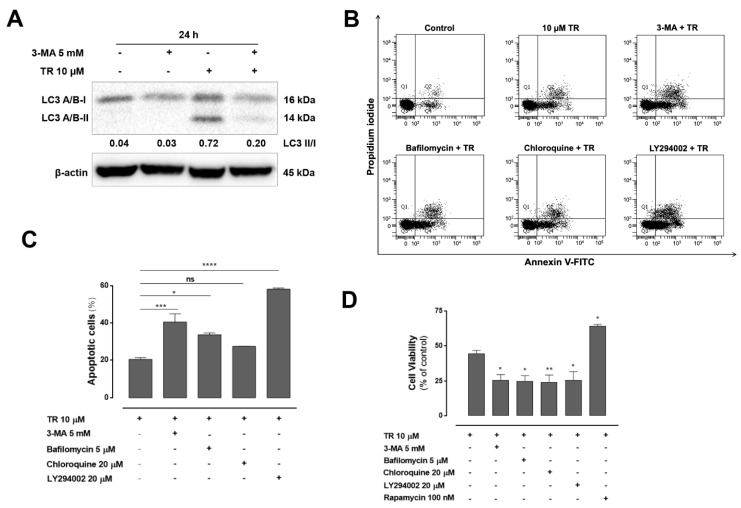
Figure 4.
Inhibition of autophagy enhanced TR-Induced apoptosis in human leukemia Jurkat cells. (A) Whole cell lysates from Jurkat cells pretreated with 5 mM 3-MA for 1 h and incubated with 10 µM TR for another 24 h were subjected to Western blot analysis for LC3 A/B. Quantification results of LC3 II/I are indicated below the corresponding blot. The data are represented as the mean of at least three independent experiments. (B) Cell death profile was analyzed by double staining flow cytometric analysis with annexin V-FITC and propidium iodide in Jurkat cells after 24 h incubation with 10 µM TR in the absence or presence of 5 mM 3-MA, 5 µM bafilomycin A1, 20 µM chloroquine and 20 µM LY294002. Representative dot plot of at least three independent experiments performed in duplicate. (C) Quantification of apoptotic (annexin V-FITC positive) cells. The results are presented as the mean ± SEM of at least three independent experiments performed in duplicate. * (p < 0.05), *** (p < 0.001) and **** (p < 0.0001) indicates a difference from TR alone. (D) Cells were pretreated with 5 mM 3-MA, 5 µM bafilomycin A1, 20 µM chloroquine, 20 µM LY 294,002 and 100 nM rapamycin for 1 h and incubated with 10 µM TR for another 24 h. Cell viability assessed by the MTT reduction test. The results are presented as mean ± SEM of at least three independent experiments performed in triplicate. * (p < 0.05) and ** (p < 0.01) indicates a difference from TR alone.

