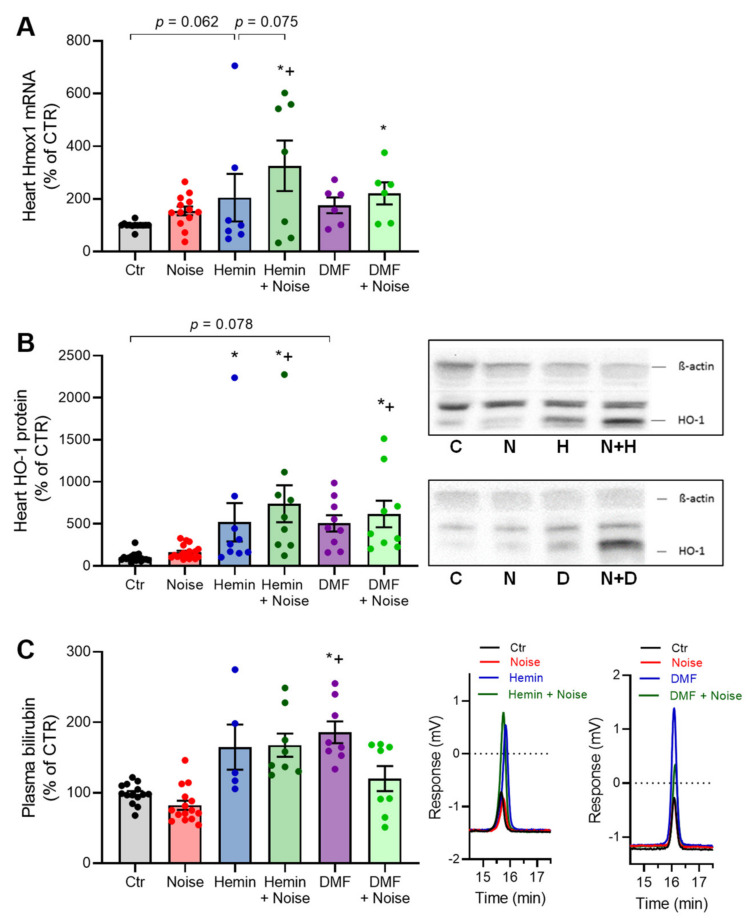
Figure 2.
Induction of HO-1 and activation of NRF2 by treatments with hemin or DMF. (A) mRNA expression of Hmox1 in cardiac tissue was measured via quantitative RT-PCR. (B) HO-1 protein expression was measured in heart tissue (representative Western blots below the densitometry). (C) Quantification and representative chromatograms of bilirubin levels in plasma as measured by HPLC analysis of bilirubin formation and expressed as changes to untreated control. Data points from (A) are measurements from 6–13 individual animals, (B) represents 9–18 individual samples (each pooled from 2 to 4 mice), and (C) represents 5–15 individual samples; * represents p < 0.05 vs. untreated control; + represents p < 0.05 vs. + Noise.

