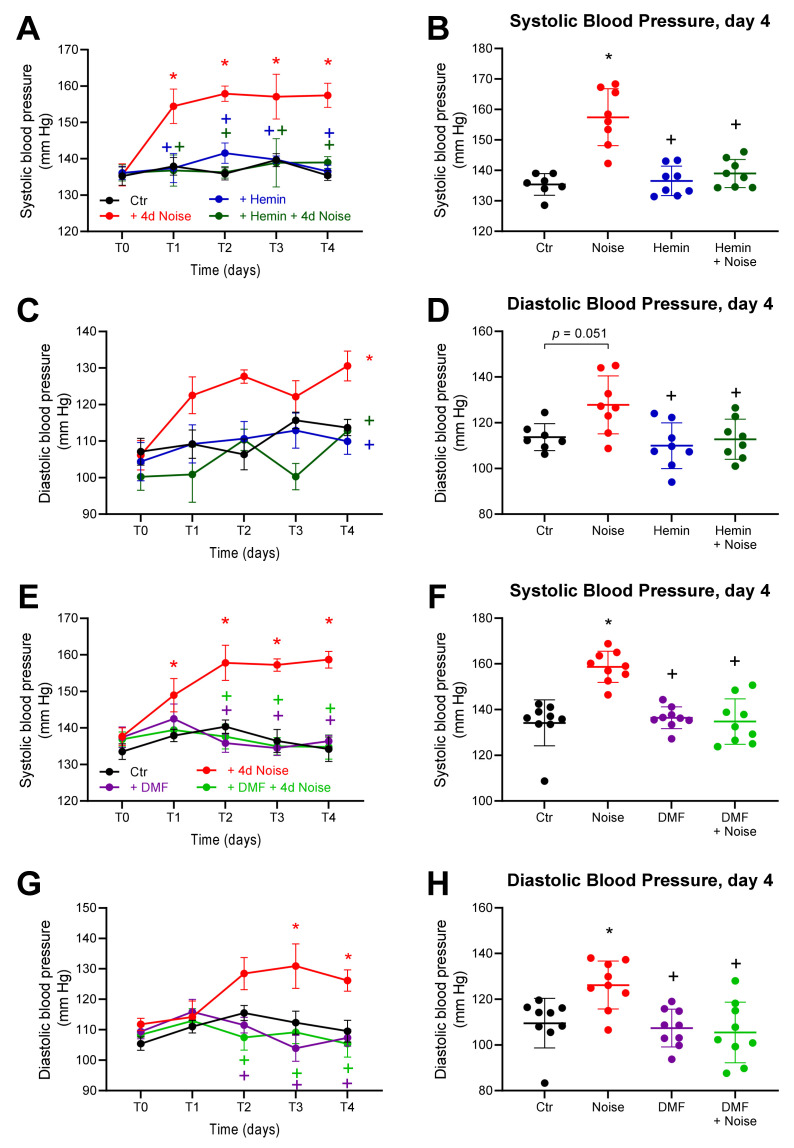
Figure 3.
Blood pressure in mice treated with inducer of HO-1 and activator of NRF2 and exposed to noise. (A,E) The time courses of systolic blood pressure over the span of the hemin and DMF treatments. (C,G) The respective time courses of diastolic blood pressure over the treatment periods. (B,D,F,H) Systolic and diastolic arterial blood pressure measured on the final day of the treatments. Data points are measurements from individual samples; n = 8–10. * represents p < 0.05 vs. untreated control; + represents p < 0.05 vs. + Noise.

