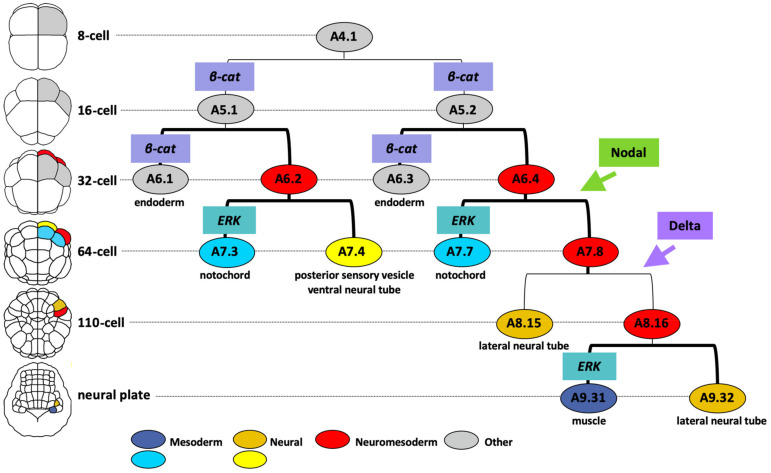
Figure 5.
Molecular mechanisms of A-lineage neuromesoderm segregation in Ciona from 8-cell stage to neural segregation. One A4.1 founder lineage is shown (the other side is identical). Cells are colored following the key at the bottom. β-catenin and ERK activity is depicted by boxes on the lineage bars, just above the cell name; signals arising from neighboring cells (Nodal and Delta) are depicted by boxes and arrows. Thick lineage brackets indicate cell division along the animal-vegetal axis (16-to-32-cell stage, 32-to-64-cell stage) or anterior-posterior axis (neural plate stage), whereas thin brackets indicate cell division along the medial-lateral axis. The positions of cells following each cell division is shown on the embryo drawings on the left, using the same color code, with the stages indicated.

