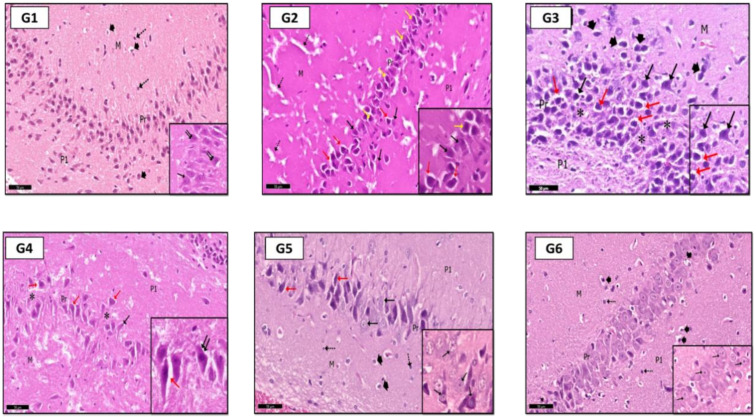
Figure 6.
Photomicrographs of CA3 area of rat hippocampus shows: in control rats (G1), CA3 area consists of three layers; molecular (M), pyramidal (Pr), and polymorphic (P1) layers. The pyramidal cells are large neurons with rounded vesicular nuclei (↑), some of them are binucleated (inset—↑↑). Molecular layer (M) has a loose appearance with glial cells (head arrow) and interneurons (dot arrow). In (G2) (PILO rats), signs of degeneration were evident, especially in pyramidal layer in the form of shrunken pyramidal cells with pyknotic nuclei (yellow ↑) with wide perineuronal spaces (red ↑; some pyramidal cells have karyolitic nuclei (black ↑). Notice pale vacuolated areas (dot ↑) in molecular layer (M) and Polymorphic (P1) layer. In (G3) (PILO+LPS rats) higher degree of cellular degeneration was recorded with empty spaces (*), pyknotic nuclei (black ↑), shrunken neurons with perineuronal spaces (red ↑) within pyramidal layer (see also inset). Molecular layer (M) shows a marked enlargement of glial cells (head arrow). In (G4) (PILO+LPS+VPA rats), few shrunken pyramidal cells (black ↑) with perineuronal spaces (red ↑) within pyramidal layer (Pr); areas of pyramidal cells loss were localized (*). Inset: higher magnification of pyramidal cells. In (G5) (PILO+LPS+Celecoxib rats), moderate signs of improvement were recorded in most of pyramidal cells (black ↑); shrunken cells with perineuronal spaces (red ↑) were rare; glial cells (head arrow) and interneurons (dot ↑) in molecular (M) and polymorphic layers (P1). In (G6) (PILO+LPS+VPA+Celecoxib rats), cellular profile was nearly as in control rats, glial cells (head arrow), interneurons (dot ↑) and pyramidal cells appear with vesicular nuclei (↑). Insets are magnifications of pyramidal layer. Stain: H&E. Bar: 50 µm. Inset ×400.

