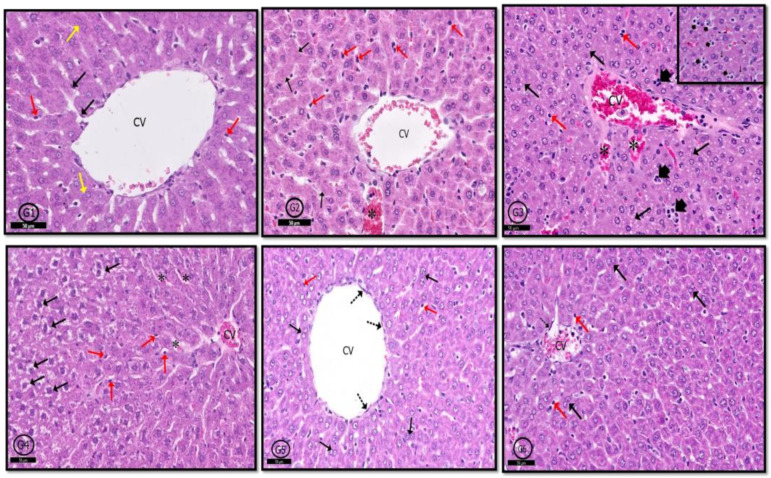
Figure 8.
Photomicrographs of rat liver of different groups. In control rats (G1), normal hepatic profile contains hepatocytes arranged in cords around the central vein (CV), some hepatocytes are binucleated (black ↑); blood sinusoids (red ↑) and von Kupffer cells (yellow ↑). In (G2) (PILO rats), hepatic architecture was generally normal but few nuclei showed karyolysis (black ↑), congestion of some blood sinusoids (*), and few prominent von Kupffer cells (red ↑). In (G3) (PILO+LPS rats) and (G4) (PILO+LPS+VPA rats) hepatic tissue showed degenerated hepatocytes with pyknotic nuclei (black ↑), congested central vein (CV); focal aggregations of inflammatory cells (head arrow—inset) and increased von Kupffer cells (red ↑) in congested blood sinusoids (*). In (G5) (PLC+LPS+Celecoxib rats) and (G6) (PILO+LPS+VPA+Celecoxib rats), hepatic architecture was nearly normal showing polyhedral hepatocytes (black ↑), von Kupffer cells (red ↑) and newly formed hepatocytes (dot ↑). Stain; H&E. Bar 50 µm Inset ×400.

