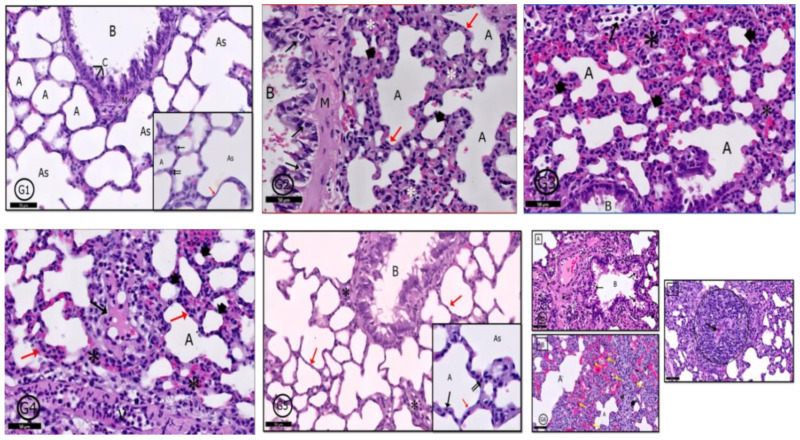
Figure 11.
Photomicrographs of the rat lung of different groups: (G1) (control rats) showed normal pulmonary profile as a bronchiole (B), alveolar sacs (As), alveoli (A) separated by interalveolar septa (red ↑) and arterioles (Ar). Clara cells (C), pneumocyte type I (↑) and pneumocytes type II (↑↑) are normal bronchial and alveolar cells (see inset also). In (G2) (PILO rats), (G3) (PILO+LPS rats) and (G4) (PILO+LPS+VPA rats) a variety of degenerative and inflammatory cells were recorded; bronchiolar wall (G2-B) contains degenerated cells (↑). Mild thickening of alveolar walls in (G2) transformed into marked thickening in (G3,G4) with inflammatory cells infiltration in the three groups (*—red ↑ in G2,G4). Many alveoli showed emphysematous widening (A) and others showed narrowing of their lumens (head arrow). Some alveoli were occupied by inflammatory cells (↑—G3) and there was inflammatory exudate in the thickened interalveolar septa (↑—G4). (G5) (PLC+LPS+Celecoxib rats) showed nearly normal pulmonary tissues however, localized inflammatory cells infiltration (*) around a bronchiole (B). The interalveolar septa appear thin in most areas (red↑). Inset: Higher magnification of the pneumocytes shows pneumocyte type I (↑) and pneumocytes type II (↑↑). (G6): (PILO+LPS+VPA+Celecoxib rats) showed A: inflammatory cells infiltration (*) surrounding the bronchiole (B), degenerated cells in bronchiolar lumen (↑), congested blood vessels (V) and acidophilic exudate in the interstitium (dot ↑). B: Narrow alveolar spaces (head arrow) and others dilated (A) with marked inflammatory cells infiltration and extravasated RBCs (*). The marked black dot appears in the interstitial tissue showing activated macrophages (yellow ↑). C: Granuloma with central caseating materials (↑). Stain: H&E. Bar 50 µm. Inset ×400.

