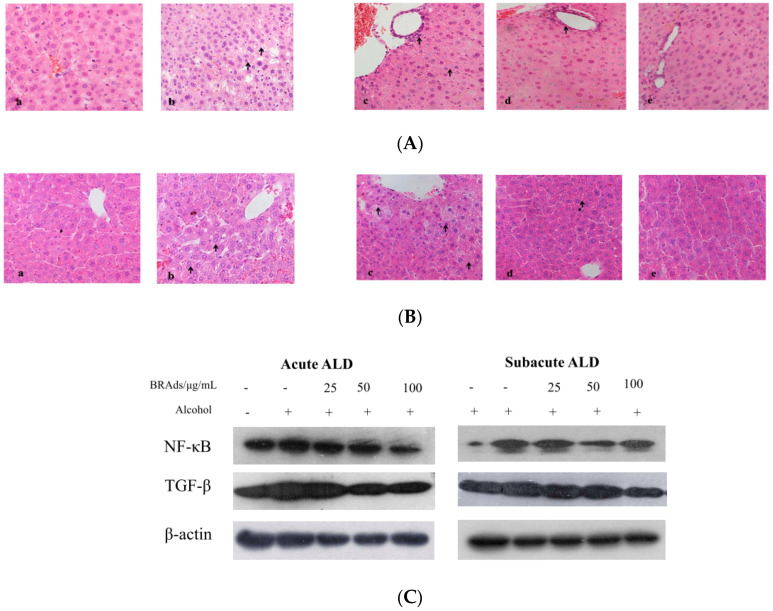
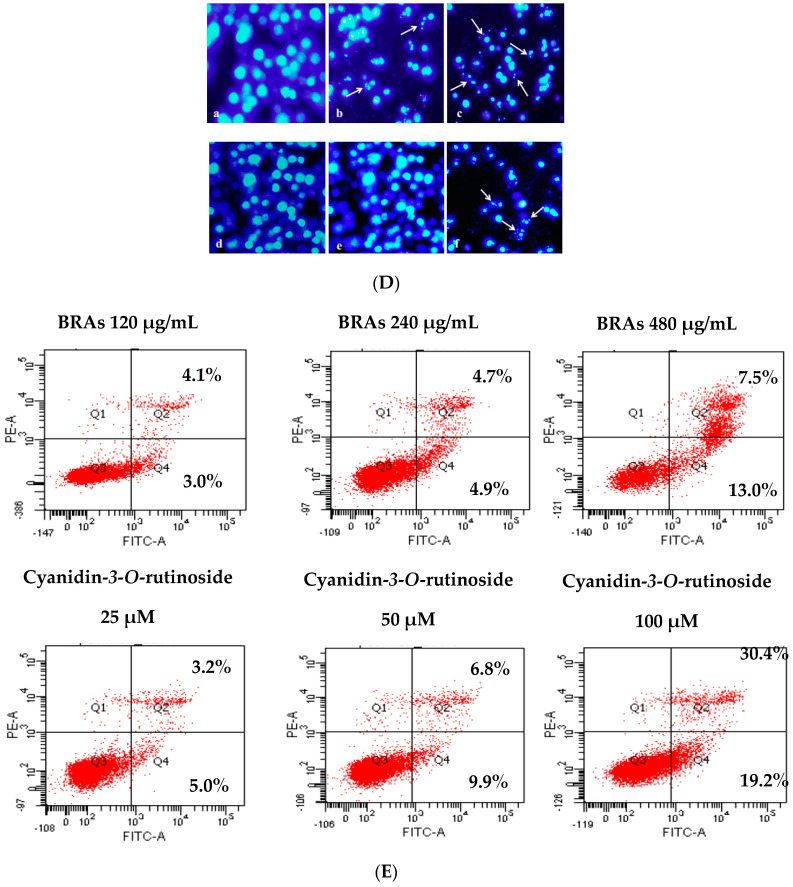
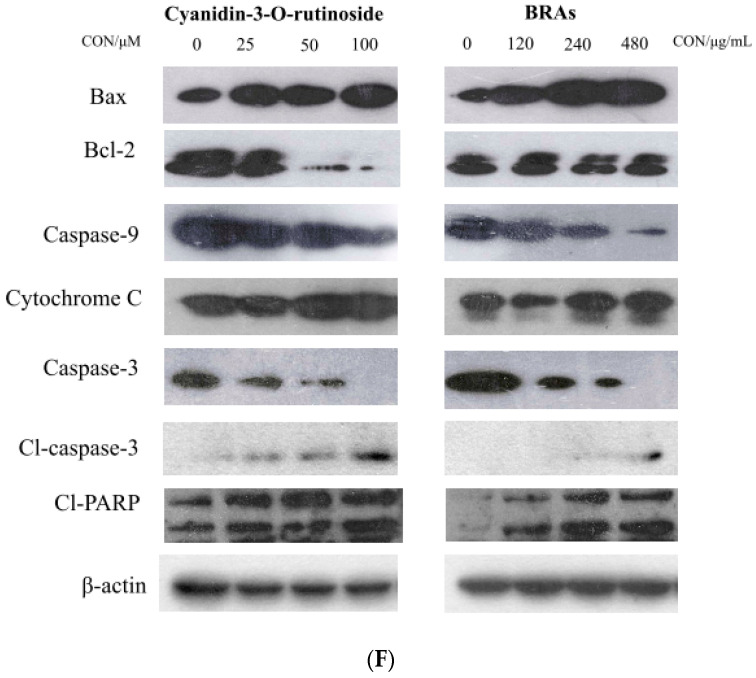
Figure 4.
(A,B) The histological analysis of BRAs on subacute (A) and acute (B) alcohol-induced liver injury (×500 magnification): (a) control group, (b) model group, (c) low-dose BRA group, (d) middle-dose BRA group, and (e) high-dose BRA group. (C) NF-κB and TGF-β expression in the liver tissue. (D) Morphological changes in HepG2 cells. (E) The induction of apoptosis was determined by flow cytometric analysis with Annexin V-FITC and PI-staining. (F) Effects of cyanidin-3-O-rutinoside and BRAs on the expression of various cell apoptosis proteins in HepG2 cells.


