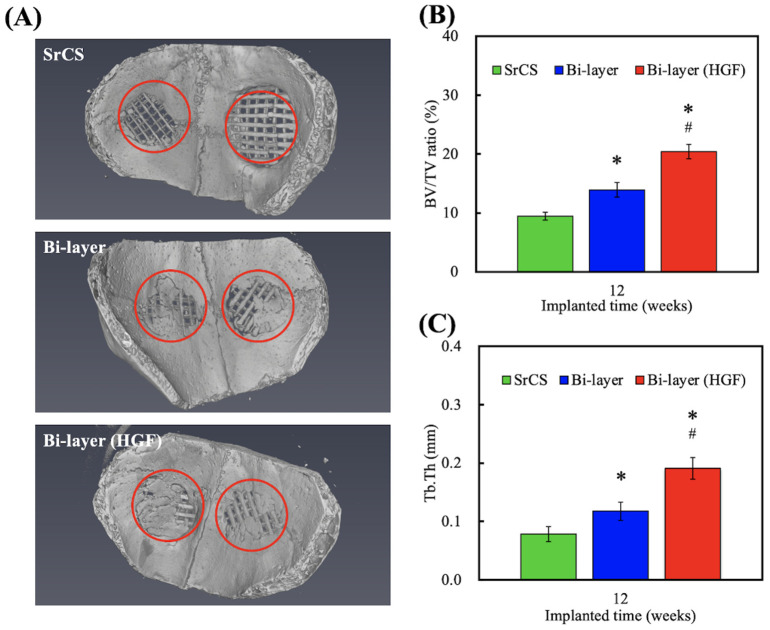
Figure 9.
(A) Representative µCT images of osteoporotic rabbits’ cranial bone defect model with different 3D-printed scaffolds after implanted for 12-weeks. The µCT-quantified histograms of (B) bone volume/total volume (BV/TV) and (C) trabecular thickness (Tb.Th). * indicates a significant difference (p < 0.05) when compared to SrCS. # indicates a significant difference (p < 0.05) when compared to bi-layer.

