FIGURE 1.
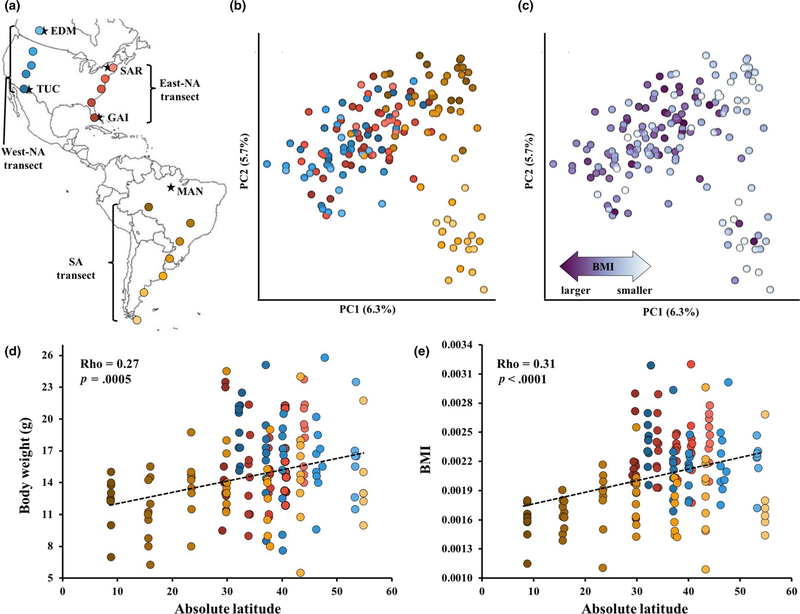
The relationship between geography, body mass and the gut microbiota of wild house mice. (a) A map of 17 population samples of house mice across the Americas (n = 161). Populations from the East-NA transect (red), West-NA transect (blue) and SA transect (yellow) are shown in circles. Black stars indicate source locations of wild-derived inbred lines from MAN, GAI, TUC, SAR and EDM (see Methods for detailed locations). (b) PCoA plot showing the effect of geography on the Bray–Curtis dissimilarity (Mantel r = .41, p < .0001). Colours correspond to the map. (c) PCoA plot showing the effect of body mass index (BMI) on Bray–Curtis dissimilarity (Mantel r = .13, p = .002). Colour intensity reflects greater BMI. Significant correlations (d) between body weight and latitude (ρ = 0.27, p = .0005) and (e) between BMI and latitude (ρ = 0.31, p < .0001). Raw p-values are shown and they all remain significant after FDR correction (Table S6)

