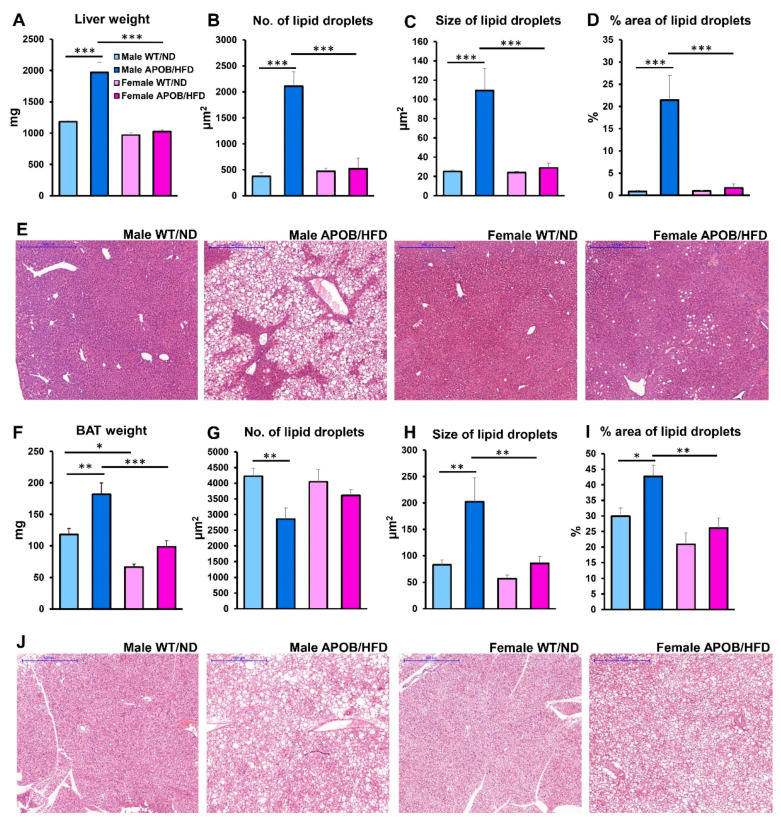
Figure 2.
Lipid accumulation in the liver and brown adipose tissue. (A) Weight of the liver and (F) BAT were measured. Then, after formalin fixation, tissues were embedded in paraffin. (E) Liver and (J) BAT sections were stained with hematoxylin and eosin. Scale bar: 500 μm. The number (B—liver, G—BAT), size (C—liver, H—BAT), and area (D—liver, I—BAT) of lipid droplets were quantified using ImageJ software (n = 6 animals/group). Values are presented as mean ± SEM; * denotes p < 0.05; ** denotes p < 0.01; *** denotes p < 0.001. WT/ND, wild-type mice on normal diet; APOB/HFD, APOB-100 transgenic mice on high-fat diet; BAT, brown adipose tissue.

