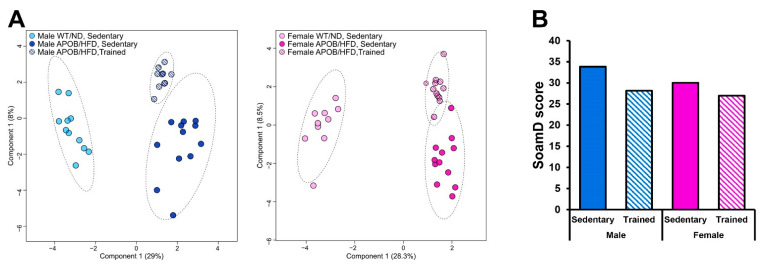
Figure 7.
Lipidomic changes in response to exercise. (A) sPLS-DA score plots of lipidomic datasets; left panel—males, right panel—females. Dashed circles display 95% confidence regions. (B) SoamD scores (sum of absolute mol% difference for membrane lipids) for the APOB-100 transgenic groups compared to the corresponding sedentary WT groups.

