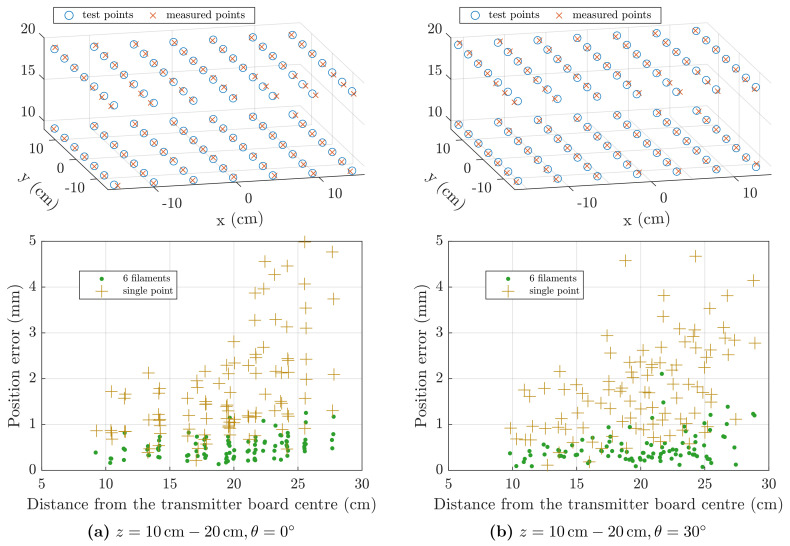
Figure 15.
Static accuracy test with real data. In the first row, test points and positions solved using the single-point model. In the second row, scatter plot of the position error, for the 6-filament and single-point models. Columns (a,b) show the results for different sensor orientations, and , respectively.

