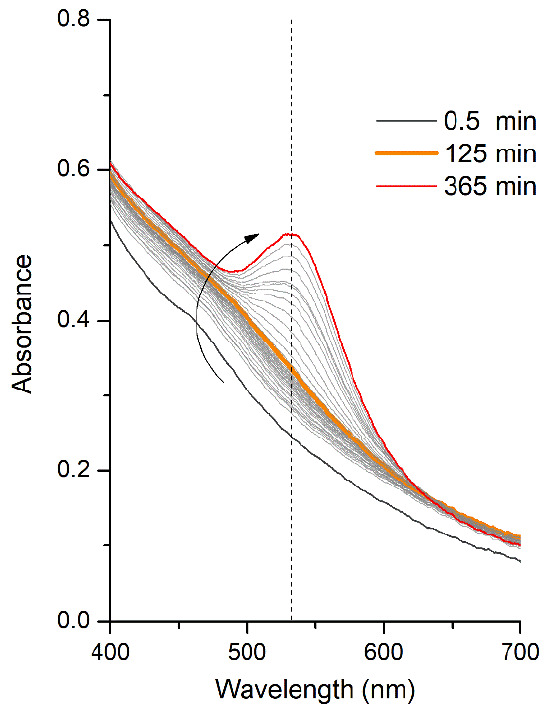
Figure 1.

UV–VIS spectra showing the process of seed formation. The orange bold line indicates the beginning of seed overgrowth at 125 min. The selected wavelength position at 532.5 nm is marked by a dotted line. The arrow indicates the time evolution.
