Figure 5.

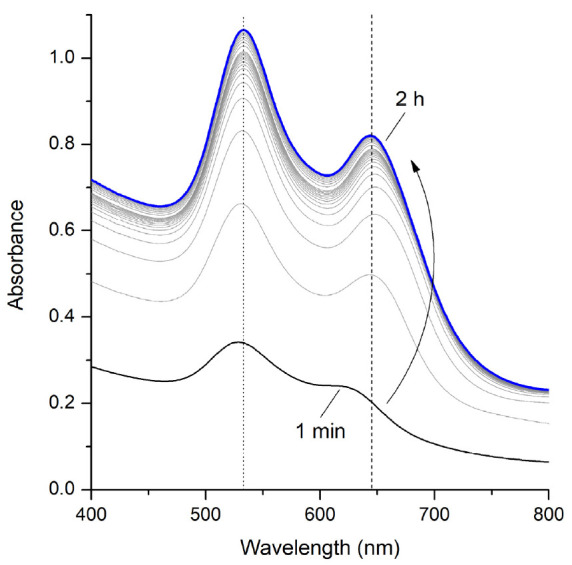
UV–VIS spectra showing the process of nanotriangle growth, selected wavelength positions at 533 and 645 nm are marked by dotted lines. The arrow indicates the time evolution.

UV–VIS spectra showing the process of nanotriangle growth, selected wavelength positions at 533 and 645 nm are marked by dotted lines. The arrow indicates the time evolution.