Figure 7.

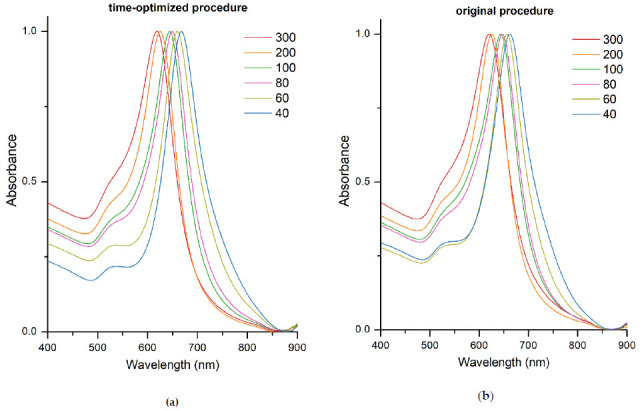
UV–VIS spectra of purified gold nanotriangles synthesized after time-optimized (a) and after original procedure (b). The legends indicate the volume (μL) of intermediate seeds used for each sample.

UV–VIS spectra of purified gold nanotriangles synthesized after time-optimized (a) and after original procedure (b). The legends indicate the volume (μL) of intermediate seeds used for each sample.