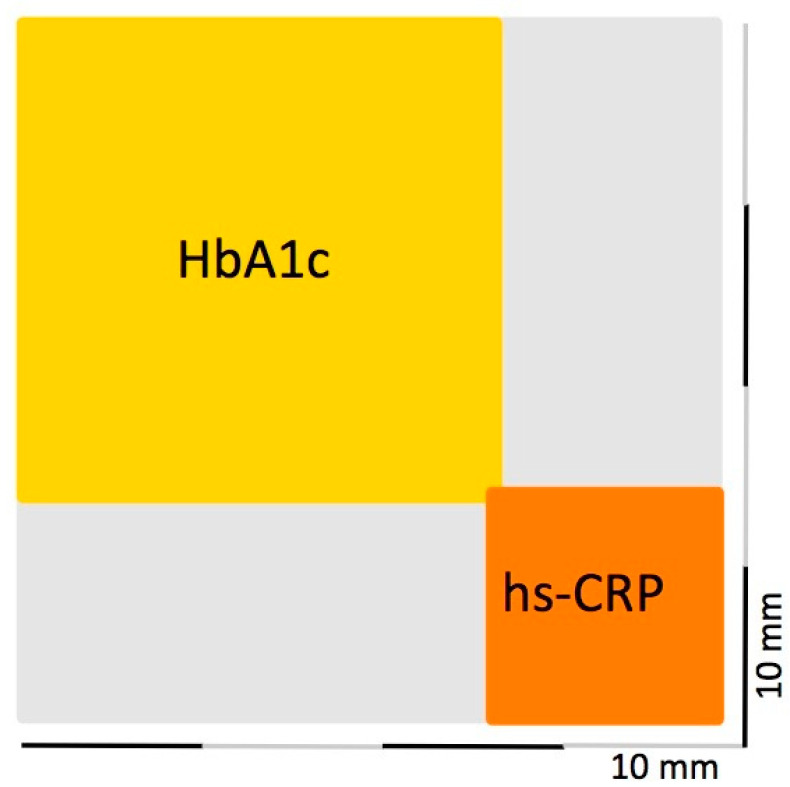
Figure 2.
Square in mm2 representing the mean PISA values for patients diagnosed as having severe periodontitis and depicting the surface area explained by glycated hemoglobin (HbA1c, yellow) and high-sensitivity C reactive Protein (hs-CRP, orange) levels. The grey area identifies the surface area attributable to other unexplored factors that influence the PISA.

