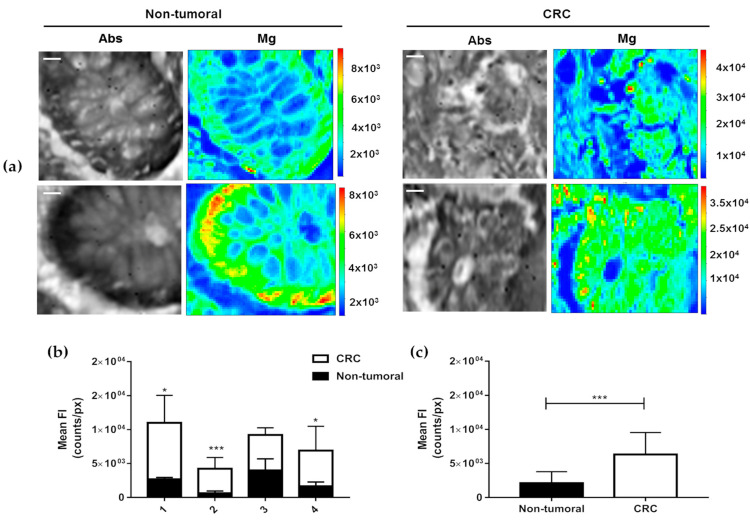
Figure 2.
XRFM analysis. (a) Tissue morphology (Abs) and Mg content and distribution of non-tumoural colon epithelium (left panel) and CRC (right panel) tissues. The images shown are representative of the four patients under study; XRFM acquisition time= 6 s/pixel, Incident Energy= 1470 eV. Scale bars are 10 μm. Analysed areas: 78 × 78 μm2 and 78 × 60 μm2. (b) Mean fluorescence intensities of total Mg counts for each patient under study and (c) overall total Mg counts obtained considering all the Mg counts from each patient under study in non-tumoural adjacent and CRC tissues. Total counts were estimated by selecting the overall XRFM analysed areas and normalising the total counts by the size of area itself (pixels). Data are presented as mean ± SD. Non-tumoural (n = 21) and CRC (n = 15). The statistical significance was determined by Students’ t-test. * p-value < 0.05. *** p < 0.001.

