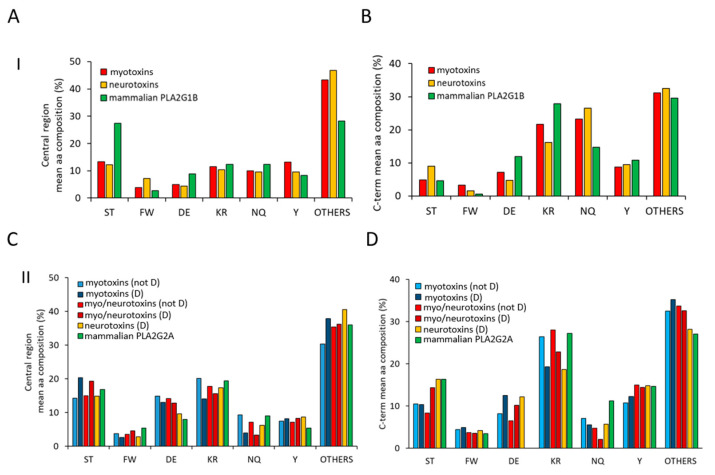
Figure 3.
Mean amino acidic composition of the two low complexity regions of sPLA2s. Analyses of the mean amino acidic compositions of the central regions (55–85) (panel A and C) and of the C-terminal stretches (from 103) (panel B and D) belonging to toxins of group I and mammalian PLA2G1B (panel A and B) and to toxins of group II and mammalian PLA2G2B (panel C and D), respectively. Evaluation of amino acidic composition was performed for each sequence using the ProtParam tool (https://web.expasy.org/protparam/, accessed on 1 March 2021), and then the mean value for each amino acid was calculated and reported in the bar diagram. Amino acids reported in the x-axis were separated based on their chemical properties (S,T = phosphorylable sites of ser/thr kinases; FW: aromatic; DE: negatively charged at neutral pH; KR: positively charged at neutral pH; NQ: amine-added amino acids; Y: aromatic phosphorylable sites of Tyr kinases; Others: A, G, V, L, I, H, P, C, M).

