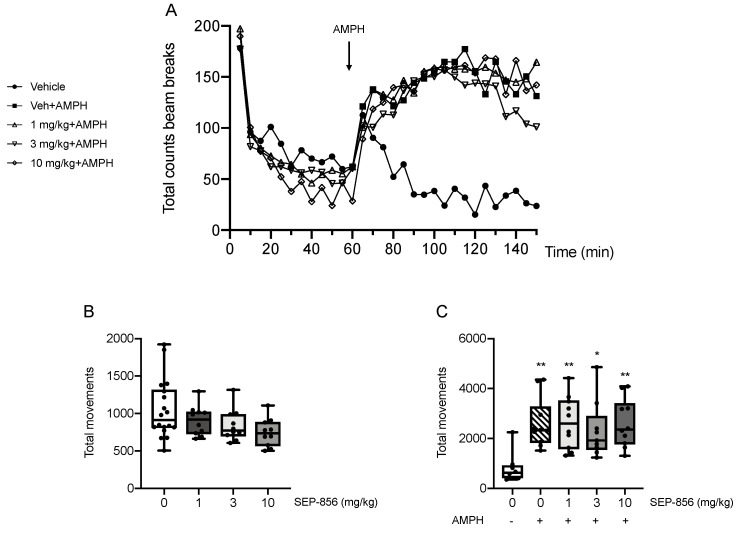
Figure 5.
Analysis of total locomotor activity. Total locomotor activity counts over 150 min (A). The first 60 min show locomotor activity after treatment with SEP-856 (1, 3 & 10 mg/kg, p.o.) or vehicle. At 60 min rats received acute injection of AMPH (0.1 mg/kg, i.p.) or vehicle, as indicated by the arrow, and locomotor activity was measured for further 90 min. The total activity was measured over the first 60 min (B) pretreatment with different doses of SEP-856 (1, 3, 10 mg/kg) and over the 90 min period (C) following AMPH administration. Data are represented as box-and-whisker plots of at least nine independent determinations (B and C). For each box, the box boundaries indicate the first and third quartiles, the middle line specifies the median and the whiskers represent the lowest and highest values. * p < 0.05, ** p < 0.01 vs. vehicle-treated rats (one-way ANOVA followed by Tukey post hoc comparison).

