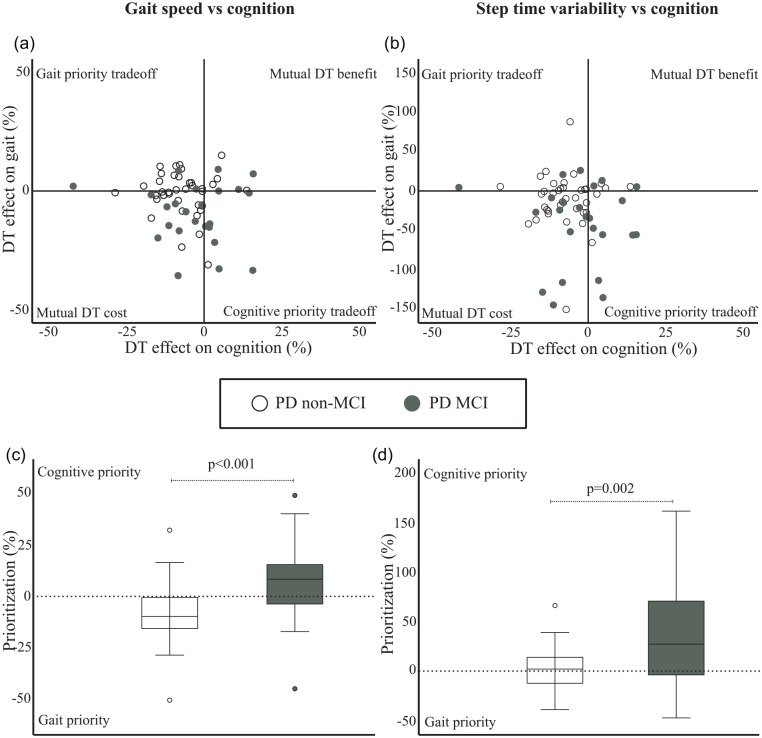
Figure 2.
Patterns of individual dual task (DT) effects between cognition and gait speed (2a), and step time variability (2b), as well as prioritization shown as boxplots (median, interquartile range and outliers) between the cognitive task and gait speed (2c), and step time variability (2d) in the PD non-MCI and PD MCI groups respectively.

