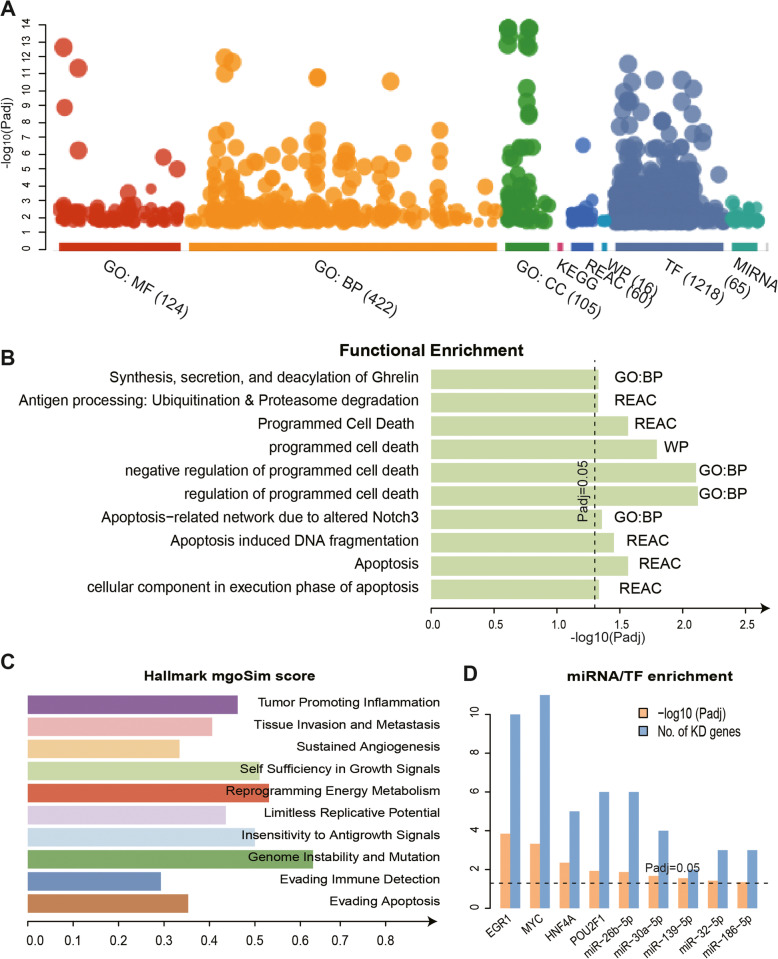
Fig. 4.
Functional enrichment analysis of KD genes. a, Functional enrichment analysis for KD genes using g:profiler online tool, including Gene Ontology (MF, BP, CC) and pathway (REAC and WP) in different colors. The Y axis represents -log10(Padj). b, The functions enriched by KD genes. The X axis represents -log10 (Padj), and the dotted line indicates Padj = 0.05. c, The semantic similarity between the functions enriched by KD genes and the known cancer hallmarks. d, The regulatory factors for KD genes confirmed by enrichment analysis. Blue indicates the number of KD genes, and orange indicates significance, −log10 (Padj)

