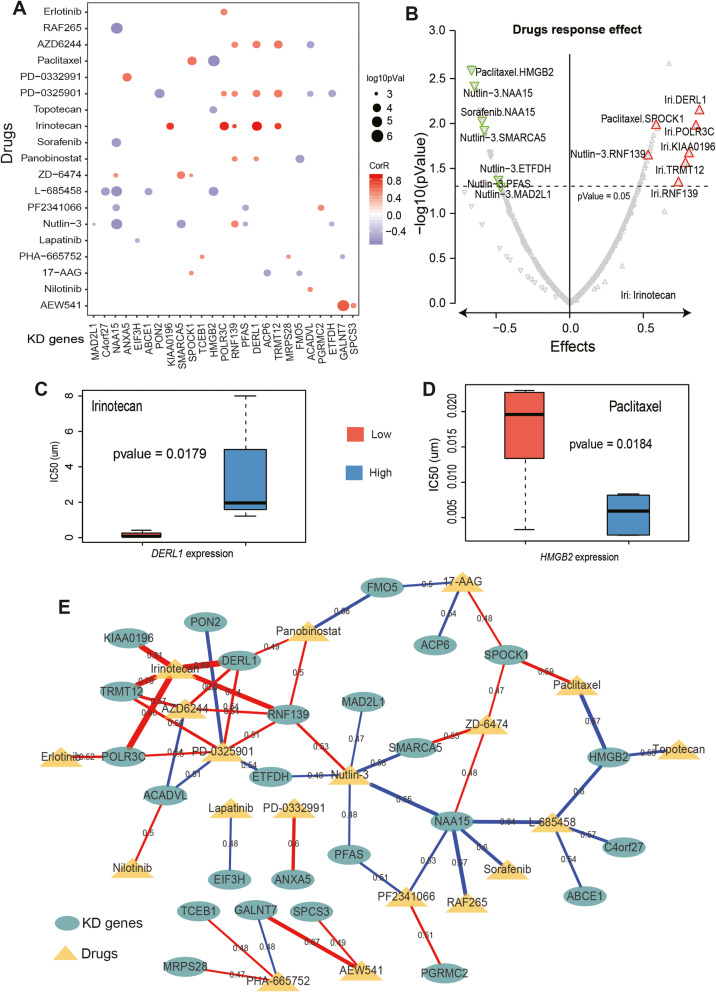
Fig. 5.
Analysis of drug response effects of KD genes. a, Correlation analysis between the expression level of KD genes and drug IC50 in CCLE cell model. The point size indicates the level of significance, and the color indicates the correlation coefficient, red (positive), blue (negative). Spearman’s Rank correlation. b, The volcano map shows the response of particular drugs, red indicates resistance, and green indicates sensitivity. c, d, The response pattern of specific drugs on KD genes, irinotecan showed drug resistance on DERL1 (c), and paclitaxel showed drug sensitivity on HMGB2 (d). e, The drug response pattern of the drugs in all KD genes in the CCLE cell model, including drug resistance (red) and sensitivity (blue), and line thickness indicates response effect

