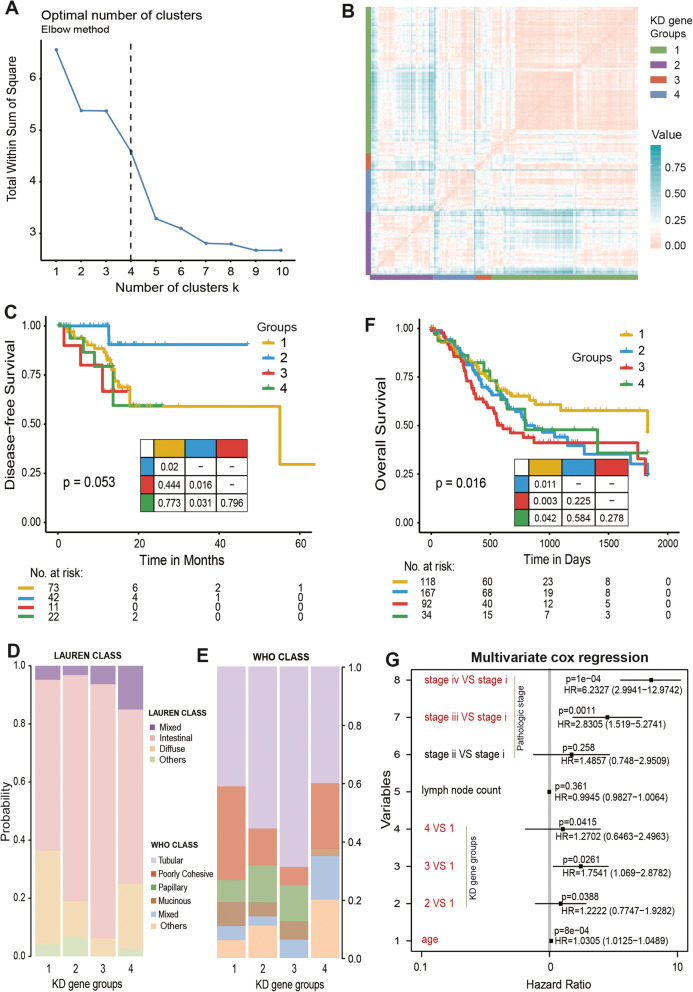
Fig. 6.
Prognostic efficacy of KD gene signatures. a, Determine the optimal number of clusters in hierarchical clustering using Elbow method. b, Clustering analysis were performed based on the expression level of KD genes, which showed pearson dissimilarity between patients with gastric cancer. c, The KM curve shows disease-free survival (DFS) time of patients across all groups, log-rank test. d, e, The proportion of patient groups of KD gene signatures in clinical features, including LAUREN (d) and WHO class (e). f, The KM curve shows the overall survival (OS) time of patients in extra data. g, Multivariate COX regression analysis (corrected tumour stage, lymph node count, and age). Red means p < =0.05

