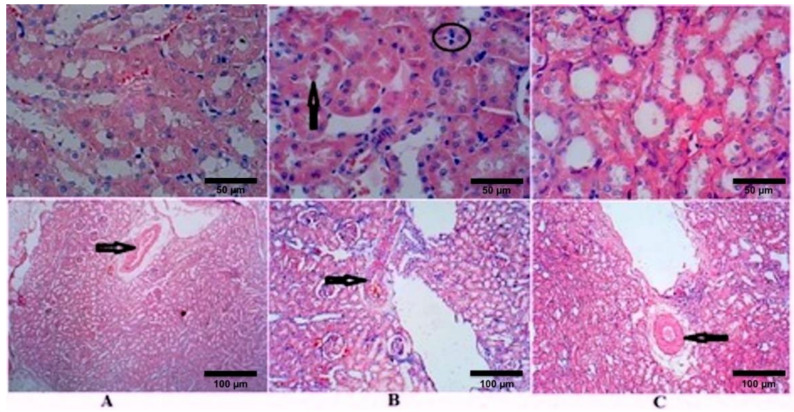
Figure 2.
Effects of streptozotocin and TQ on tubulointerstitial morphology (upper images) and on arteriolosclerosis (lower images). (A) Control group (Group I), (B) untreated diabetic group (Group II), and (C) TQ-treated diabetic group (Group III). The vertical black arrow indicates hyaline droplets, inflammatory cells are enclosed in a black circle, and arterioles are indicated by horizontal black arrows. H&E stain; magnification = 400 X in the upper images and 100 X in the lower images.

