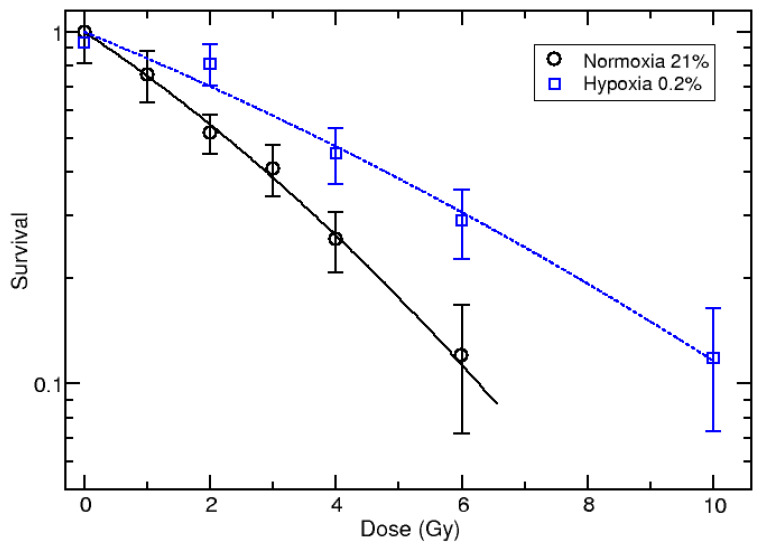
Figure 1.
Survival curve of U87 cells irradiated in normoxia (O2 = 21%) from updated data [9] and hypoxia (O2 = 0.2%) with 62 MeV proton beam. The measured values are shown with black circles (normoxia) and blue squares (hypoxia), and the lines correspond to the linear–quadratic fit of measured data.

