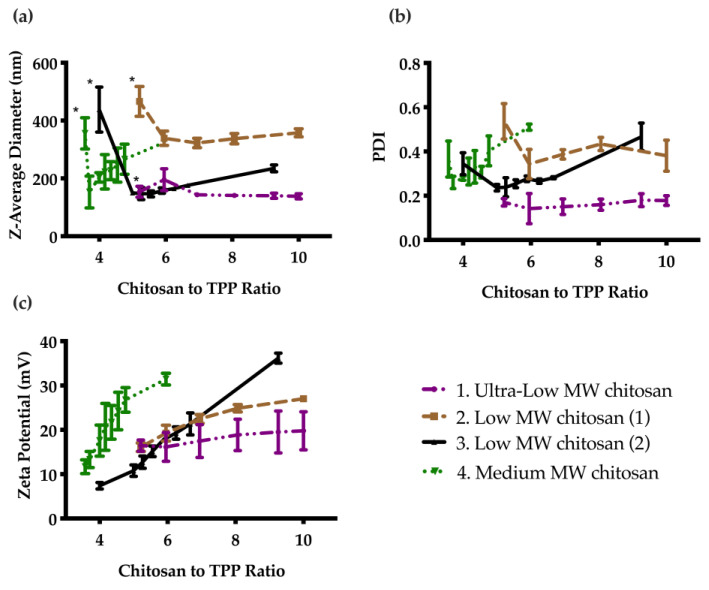
Figure 1.
Effect of chitosan to TPP mass ratio on particle properties as measured by DLS: (a) Z-average diameter; (b) PDI; and (c) Zeta potential. Error bars correspond to the standard deviations on triplicate particle preparations. The particles were unstable and sedimented below a certain ratio (indicated by *), then the diameter generally decreased as the ratio was increased, and finally increased as the ratio was further increased. PDI followed a similar trend, while the zeta potential continually increased due to the increasing cationic charge with increasing chitosan to TPP ratio.

