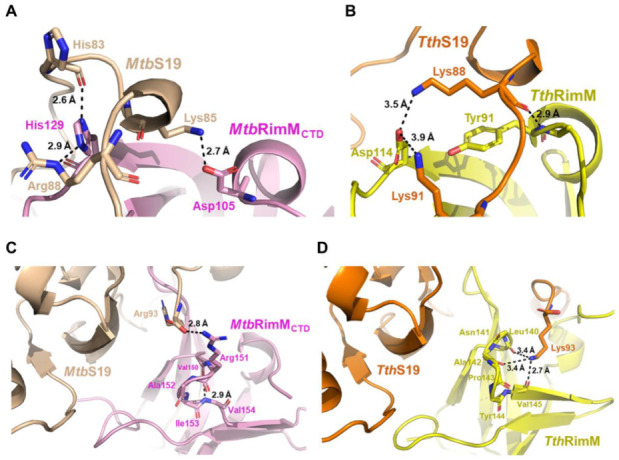
Figure 9.

Comparison between the docking model of MtbRimMCTD–S19 complex and the crystal structure of TthRimM–S19 complex. (A,B) Illustration of the stabilized short helix located in the long C-terminal loop of S19 and nearby residues within the docking model of MtbRimMCTD–S19 (A) or the crystal structure of TthRimM–S19 (PDB: 3A1P) (B). Atom distances are shown beside the corresponding black dashed lines. (C,D) S19 C-terminal residue Arg93 involved in the interaction of MtbS19 with MtbRimMCTD (C) or Lys93 in that of TthS19 with TthRimM (D). Atom distances are shown beside the corresponding black dashed lines.
