Figure 1.
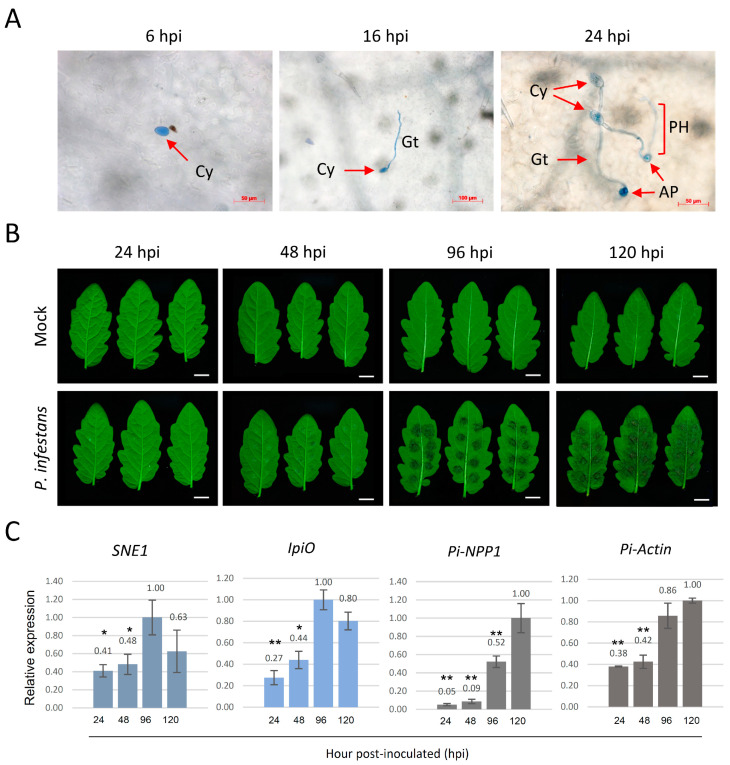
Inoculation of detached tomato leaflets by P. infestans. Detached leaflets of five-week-old tomato plants were inoculated with P. infestans by placing a 20 μL drop of inoculum at eight spots on the abaxial surface of the leaflets. (A) Microscopic assessment of P. infestans developing on tomato leaflets at different time points post-inoculation after staining with trypan blue. At 6-h post-inoculation (hpi), the pathogens remained as cysts and started to germinate at 16 hpi. At 24 hpi, the primary hyphae (PH) were developed and the appressorium (Ap) structure was generated, indicating that the pathogen was ready to invade the plant cells. (B) Example leaflets showing P. infestans lesion development at 24, 48, 96 and 120 hpi. The white bar represents 1 cm. (C) Bar graphs showing the relative band intensity of reverse transcription-polymerase chain reaction (RT-PCR) products of P. infestans marker genes, SNE1, IpiO, and PiNPP1.1 is shown in Figure S1. The RNA samples were extracted from tomato leaflets at 24, 48, 96, and 120 hpi. The relative transcript abundance is shown as a proportion of the most intense band in each gel image. The expression level of P. infestans actin was used to evaluate the biomass of the pathogen in tomato leaves. The expression levels of biotrophic stage markers (SNE1 and IpiO) were reduced after 96 hpi, and the necrotrophic stage marker (PiNPP1.1) was continuously increased from 24 hpi to 120 hpi. The error bars are standard deviations and the graph represents the combined data from three biological replicates (n = 3). Differentially regulated genes with a p-value of less than 0.05 or a p-value of less than 0.01 are marked with single or double asterisks, respectively. Cy, cyst; Gt, germ tube; AP, appressorium; PH, primary hyphae.

