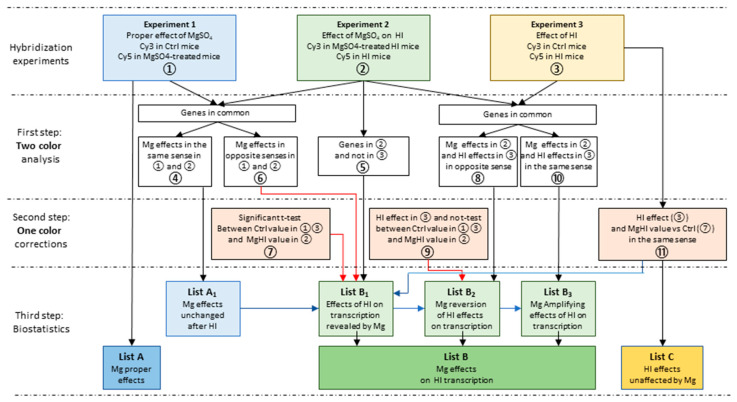
Figure 2.
Detailed procedure of extraction of List A of proper effects of MgSO4 treatment, and List B collecting the different MgSO4 modulation of HI response to HI in P5 brain. All three experiments were analyzed independently (first step analyses in two-color co-hybridization experiments), providing lists of genes noted ①, ②, and ③. The genes detected in experiment 1 provided the List A of proper effects of MgSO4 single injection, to be submitted to pathway and gene ontology analyses. Coincident observations in ① and ② were extracted and split into two sub-series (④ and ⑥). List B constitutes the effects of MgSO4 seen only in the HI context (List B1), MgSO4 reversion of HI effects (List B2), and MgSO4 amplification of HI effects (List B3), combining two-color and one-color analyses. The subseries of List A (④)—containing genes showing induction after MgSO4 injection in both control (①) and HI-exposed (②) animals regrouping the genes affected by MgSO4 that were unchanged after HI—was subtracted from List B. List C contains genes affected by HI in control as well as in MgSO4-pretreated mice. Black and Red arrows indicate two-color and one color insertions; blue arrows indicate subtractions in destination boxes.

