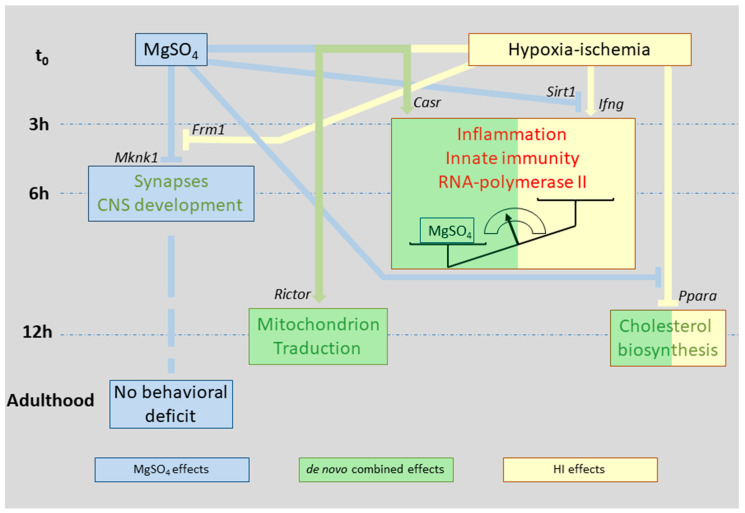
Figure 10.
Simplified schematic effects of MgSO4 (in blue) and HI (in yellow) applied separately or in association (in green) with transcription in 5-day-old mouse brain hemispheres. Genes identified as putative upstream regulators of main effects are indicated. Red or green lettering indicate function activations and inhibitions, respectively.

