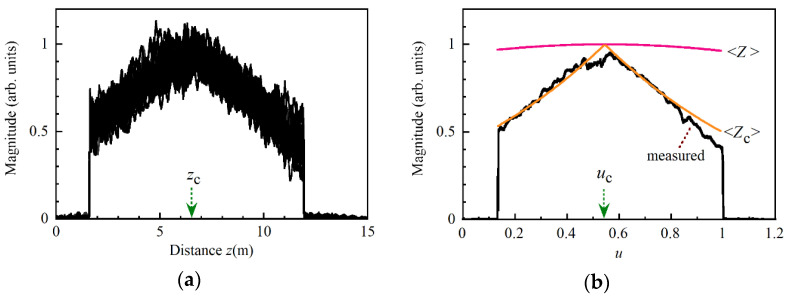
Figure 13.
(a) Overwrite of 30 reflectograms from a 10 m long polarization-maintaining (PM) fiber. zc (= 6.51 m) is the distance to the center of pumping. (b) Mean reflectogram (shown in black), which was derived from the 30 reflectograms shown in (a). <Z> is a plot of the Gaussian function defined by Equation (17) with Δrms = 3.74 × 10⁶ rad/s, τe = 115 ns and uc = 0.545. <Zc> is a plot of Equation (28), which is the product of Gaussian and exponential functions where δνL = 2 MHz.

