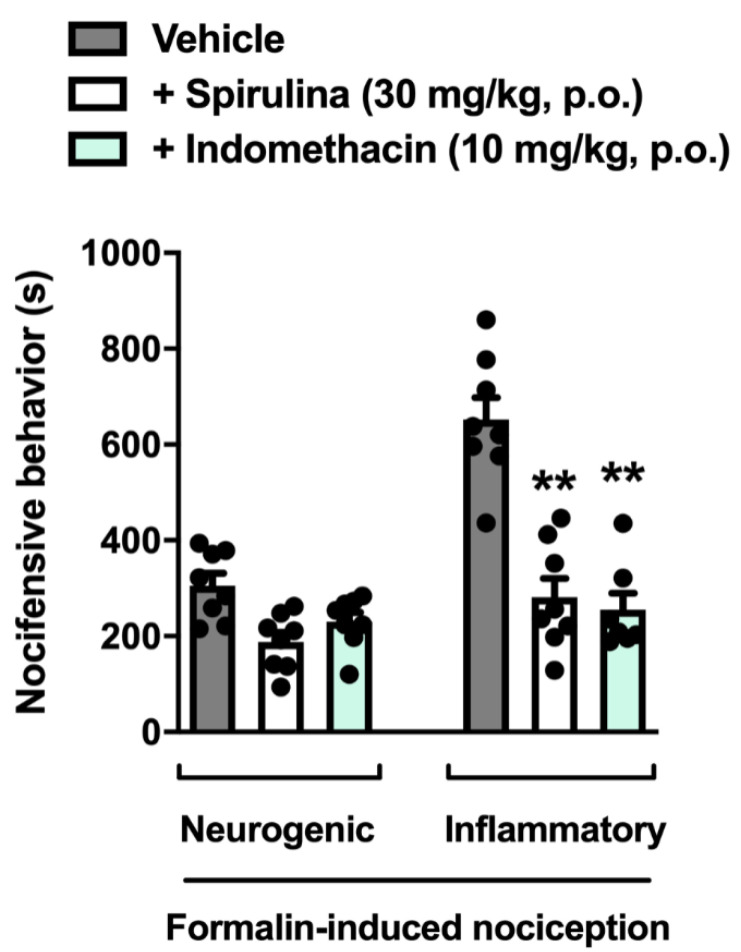
Figure 3.
Effect of Spirulina on nocifensive behavior induced by formalin in mice during the first (neurogenic) and second (inflammatory) phases. Each column represents the mean ± SEM of 7–8 animals/group, with a black dot showing individual mice. Asterisks indicate the levels of significance compared to the vehicle (control) group. ** p < 0.001 using one-way ANOVA.

