Figure 1.
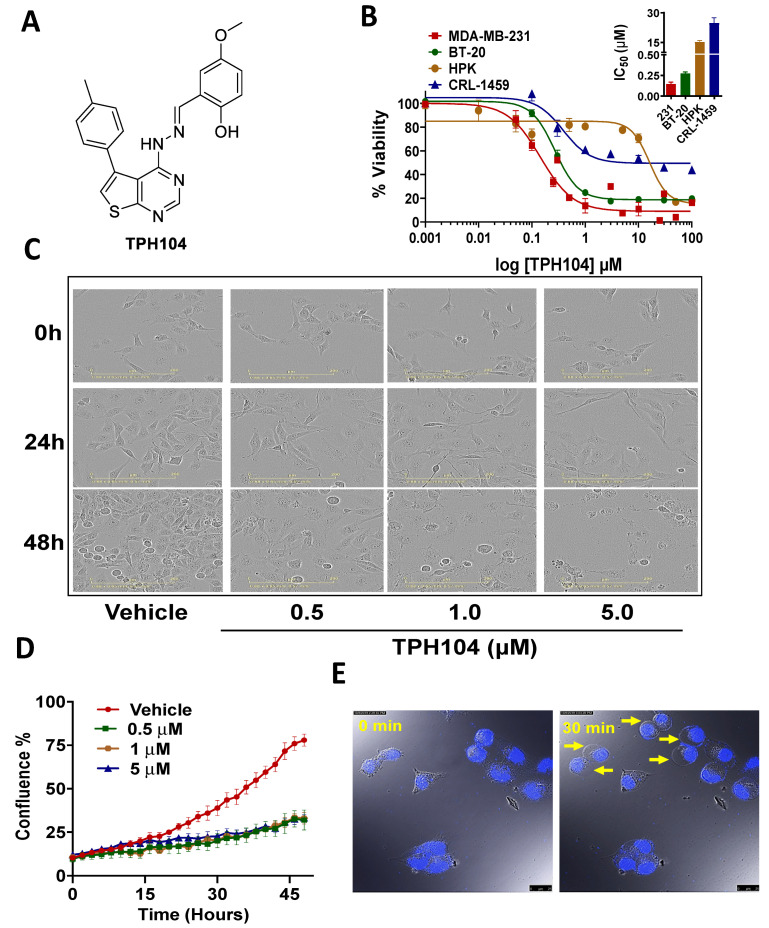
TPH104 induces non-apoptotic cell death pathway in MDA-MB-231 cells. (A) Chemical structure of TPH104. (B) Dose–response curve of TPH104 in MDA-MB-231, BT-20, HPK, CRL-1459 cells after 72 h treatment using MTT assay. In the inset, a bar graph depicting the IC50 ± SEM values of TPH104 for MDA-MB-231, BT-20, HPK and CRL1459 cells are shown. Data shown are mean ± S.E.M, n = 3 independent experiments. (C) Representative images showing morphological changes in MDA-MB-231 cells (20×) after incubation with either vehicle (media with ˂0.1% DMSO) or TPH104 (0.5, 1.0 and 5.0 µM) at 0, 24 and 48 h post-treatment. Scale bars: 200 µm. (D) Cell confluence (%) calculated using IncuCyte S3 software based on phase-contrast images of MDA-MB-231 cells from 0 to 48 h post-treatment with vehicle (media with ˂0.1% DMSO) and/ or different concentrations of TPH104. (E) Time-lapse microscopy reveals swelling of the plasma membrane during cell death, measured in MDA-MB-231 cells with nuclei stained with PI induced by 10 µM of TPH104. The images were derived from Video S1.

