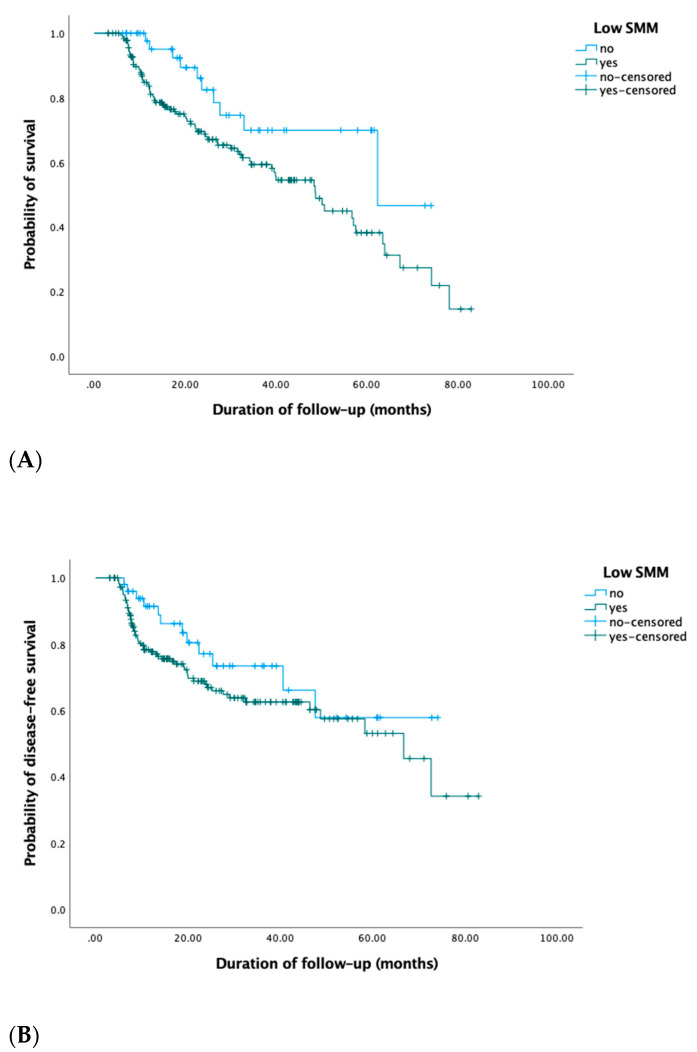
Figure 2.
Kaplan–Meier OS (A) and DFS (B) curves of patients with low SMM at diagnosis showed decreased OS (log-rank Chi-square 5.1, p = 0.02) and DFS (log-rank Chi-square 2.0, p = 0.2) compared to patients without low SMM, although this finding was only statistically significant for OS and not DFS.

