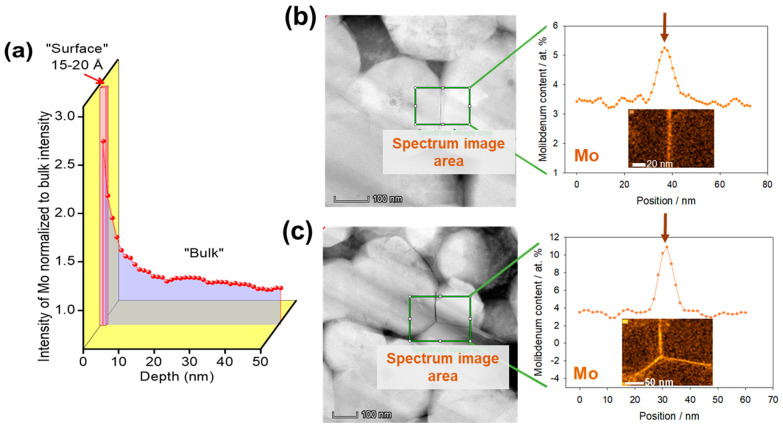
Figure 3.
(a) The depth profiles of Molybdenum obtained from ToF-SIMS studies of NCM85 Mo-doped material demonstrating the dopant segregation at the outermost surface layer of ~15–20 Å. Note that due to high roughness of the powder NCM85 samples, “surface” and “bulk” regions are shown only schematically, as an eye guide. (b,c) HAADF-STEM images and the corresponding EDX maps of the Mo-Kα measured from NCM85 Mo-doped material demonstrating the enrichment of the grain boundaries with the dopant. Spectral image areas are shown with green-line rectangles. The grain boundaries are marked with arrows.

