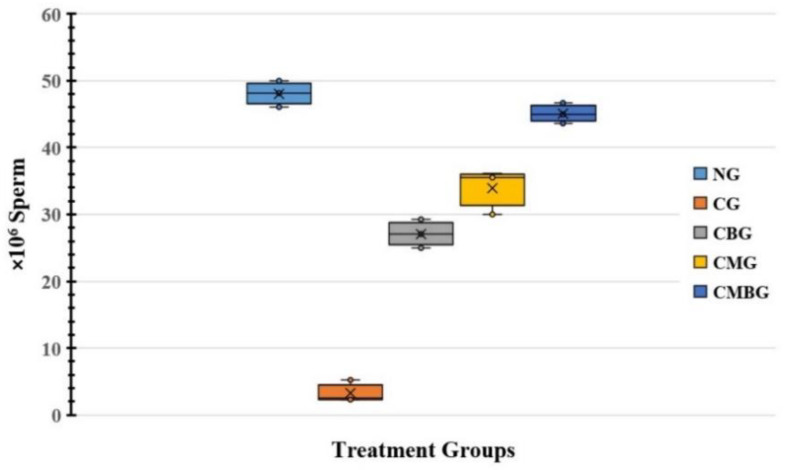
Figure 1.
Box and whisker plot for sperm counts in the treated groups. The groups are: the control group (NG); the Cisplatin-treated group (CG); the Cisplatin+ beetroot extract-treated group (CBG); the Cisplatin+ mesenchymal stem cells-treated group (CMG); and the Cisplatin+ mesenchymal stem cells + beetroot extract-treated group (CMBG). The interrelations between all the presented groups are statistically significant (p ≤ 0.05). Group mean is presented by x symbols in the boxplots.

