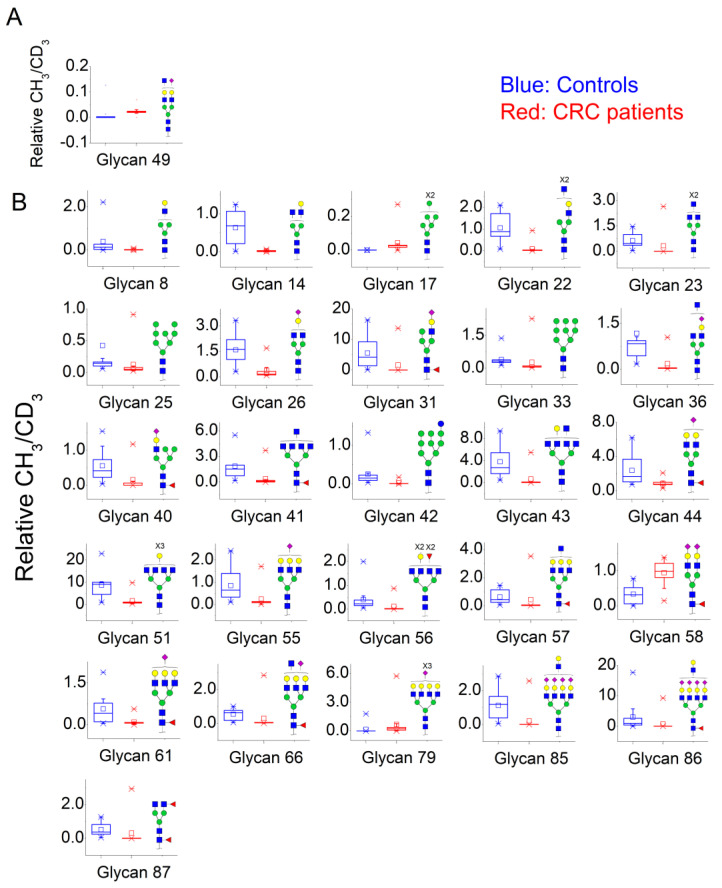
Figure 3.
Box plots showing relative abundance of up- and down-regulated N-glycans isolated from blood serum of cancer patients and control patients (Mann–Whitney U test, α = 0.01) analyzed by (A) MALDI-TOF/MS and (B) LC-MS/MS. The lower and upper whiskers represent the 5th and 95th percentile, respectively, while the median is represented as a straight line, the mean by an open box (⎕), and data outliers are represented by the X symbol.

