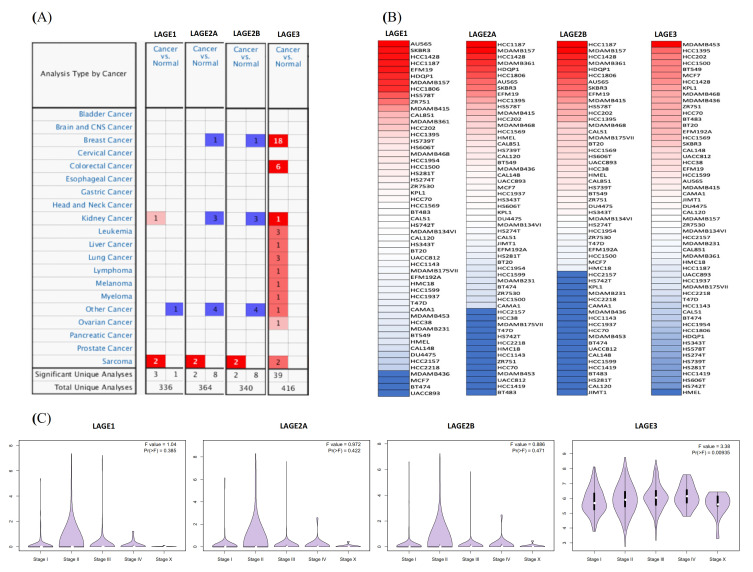
Figure 1.
Expressions of L-antigen family genes through cancer tissues. (A) LAGE genes expression profiles of 20 types of cancer and normal patients. Decreasing gene rank percentiles are indicated as a color gradient. p value < 0.05, multiple of change of >1.5-fold, and a gene rank percentile of <10% in cancer compared to normal tissues were considered as threshold. (B) Heatmap plots collected from the CCLE database show LAGE expression levels in all breast cancer cell lines. Expression levels of LAGEs varied in different breast cancer cell lines. The up blocks with red color illustrate over-expression, and the down blocks showed under-expression. (C) Differential expressions of explicit LAGE family members were demonstrated in violin plots derived from the TCGA breast cancer database with a significant p-value set. By using TCGA and METABRIC databases, various stages of tumor across LAGE family gene expression profiles were explored. More elevated gene expression levels of LAGEs were found in higher-stage breast cancers than in lower-stage cancers and normal tissues. Only LAGE3 was clearly shown, whereas the others are still not clear.

