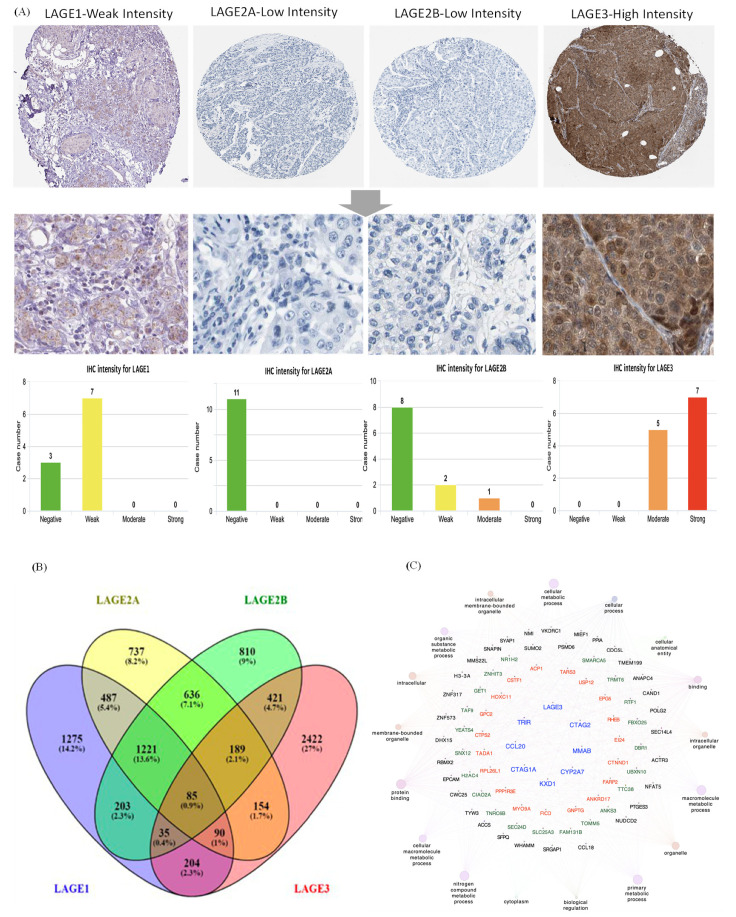
Figure 2.
Expressions of L-antigen family genes throughout breast cancer tissues. (A) LAGE family genes, protein expressions in normal breast tissue, and breast cancer specimens from the Human Protein Atlas. Bar charts of the IHC staining intensity of LAGE family genes for breast cancer dictionary (10, 11, 11, 12 cases for LAGE1, LAGE2A, LAGE2B, LAGE3, respectively). (B) Venn diagram of LAGE family co-expression genes lists in TCGA breast cancer databases. The intersection of co-expression gene lists of each gene in the LAGE family. The approach was to select the top 20% of genes from the list of co-expressed genes extracted from the METABRIC dataset. (C) Through a Cytoscape analysis, thresholds were set to show pathways with p-value < 0.05, Network specificity as “Global”, Network Connectivity as “Medium”, and high correlations between LAGEs and metastasis markers were observed.

