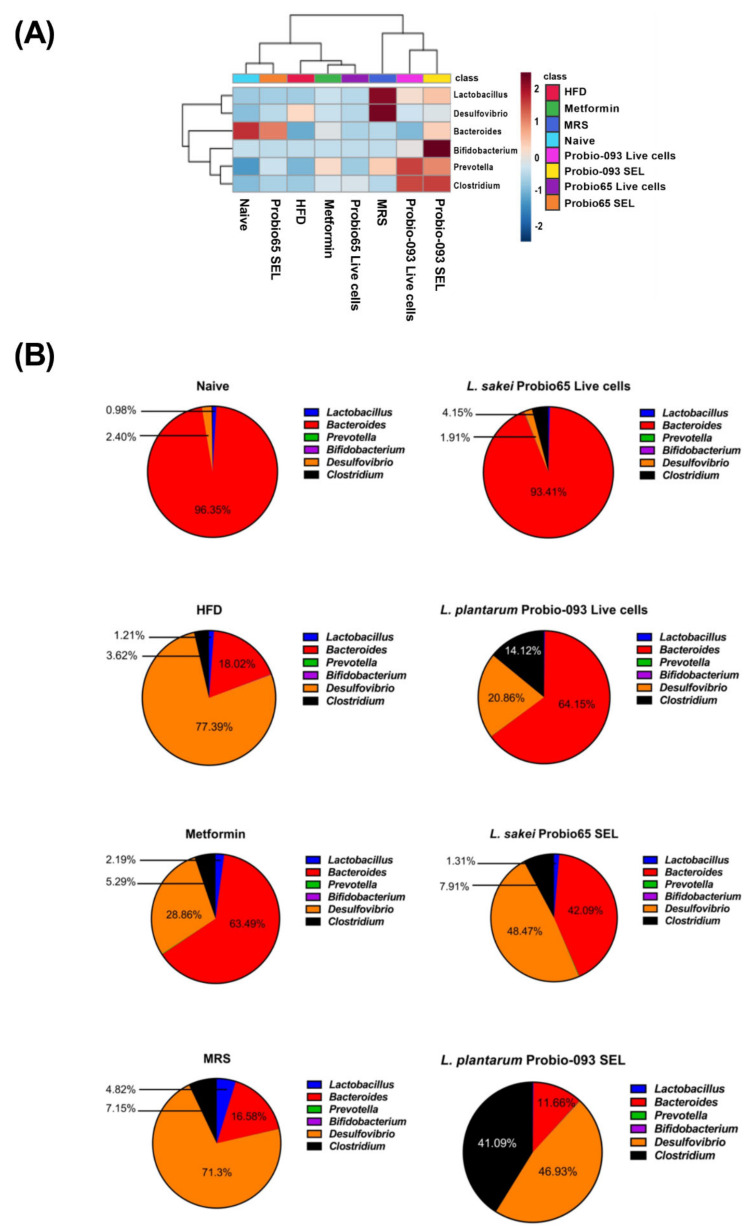
Figure 6.
(A) Heat map analysis of six dominant genus and (B) Genus distribution profile determined in the fecal samples of mice after 8 weeks of high-fat diet treatment. Heat map distinguished abundance of each genus through different color codes with values normalized from 2 to −2; red indicating high abundance and blue showing low abundance. The proportion of predominant bacteria is also presented in the form of pie chart. Naïve: untreated mice fed with normal diet (n = 5); HFD: untreated mice fed with high-fat diet containing 45 kcal% fat (n = 5); Metformin: mice on high-fat diet (45 kcal% fat) and gavaged with metformin (0.25 mg/g/day); MRS: mice on high-fat diet (45 kcal% fat) and gavaged with De Man, Rogosa and Sharpe; Probio65 Live cells: mice on high-fat diet (45 kcal% fat) and gavaged with live Lactobacillus sakei Probio65 (10⁸ CFU/day); Probio-093 Live cells: mice on high-fat diet (45 kcal% fat) and gavaged with live Lactobacillus plantarum Probio-093 (10⁸ CFU/day); Probio65 SEL: mice on high-fat diet (45 kcal% fat) and gavaged with ethanolic extract of Lactobacillus sakei Probio65 (5 µL/g/day); Probio-093 SEL: mice on high-fat diet (45 kcal% fat) and gavaged with ethanolic extract of Lactobacillus plantarum Probio-093 (5 µL/g/day). Mice fecal samples were collected after 8 weeks of treatment. Data are represented as ± S.E.M.

