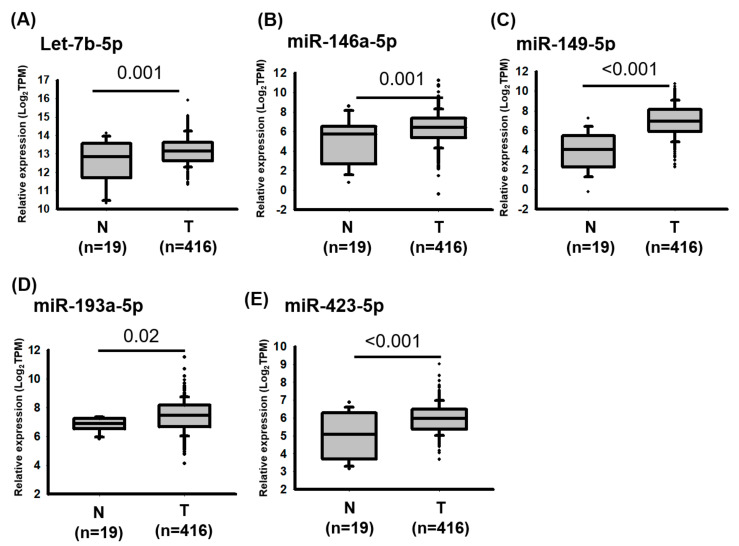
Figure 2.
Expression levels of miRNA candidates in bladder cancer were revealed through an analysis of the TCGA database. Expression levels of (A) let-7b-5p, (B) miR-146-5p, (C) miR-149-5p, (D) miR-193a-5p and (E) miR-423-5p were examined by analyzing The Cancer Genome Atlas database. The transcriptome profiles of 435 patients with bladder cancer were downloaded from said database, including 19 adjacent normal tissues and 416 bladder cancer tissues. The expression levels of miRNAs are presented in transcripts per million (TPM). Those of individual miRNAs were analyzed using Student’s t tests.

