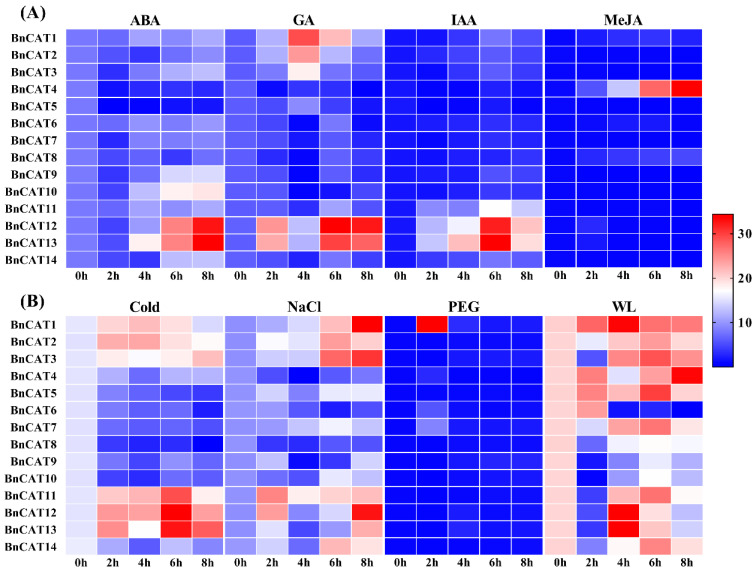
Figure 8.
Expression patterns of the BnCAT genes under various hormones and abiotic stress. (A) Expression profiling during hormone treatments, including abscisic acid (ABA), gibberellic acid (GA), indole-acetic acid/auxin (IAA), and methyl jasmonate (MeJA). (B) Expression profiling under abiotic stresses, including cold, salinity (NaCl), drought (PEG-6000), and waterlogging (WL). The 0 h (CK), 2 h, 4 h, 6 h, and 8 h labels displayed the time points (hours) when the samples were harvested for expression analysis after the stress treatment. The bars show the comparative gene expression patterns examined via the 2−ΔΔCT method. The red color shows high, and the blue color shows low expression levels.

