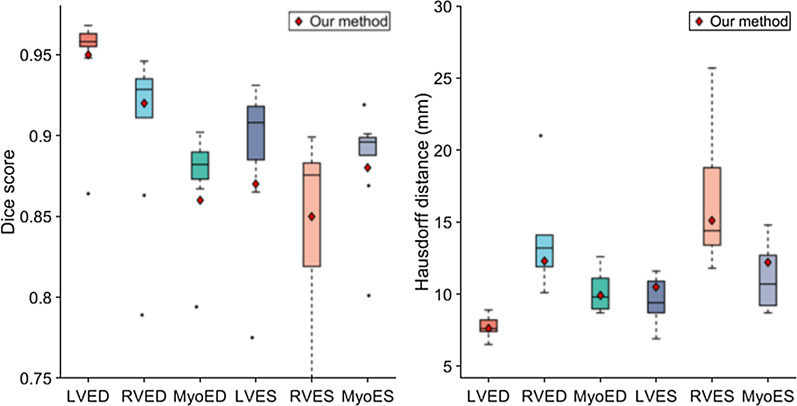
Fig. 5.
Comparison of the segmentation accuracy of our method with the top 10 methods of the ACDC challenge on the testing dataset. In these box-and-whiskers plots the middle horizontal line represents the median, box hinges represent first and third quartiles, whiskers represent extreme values within 1.5 times the interquartile range, and asterisks represent outliers. The red diamond represents the result of our method. LV left ventricle cavity, RV right ventricle cavity, Myo left ventricle myocardium, ED end-diastolic, ES end-systolic

