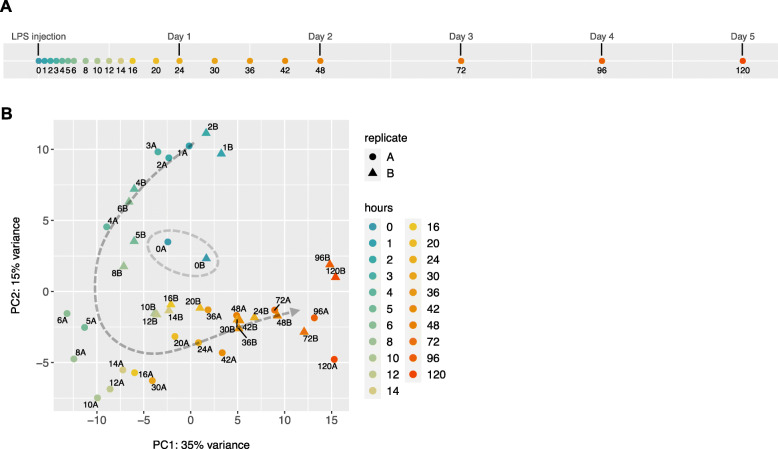
Fig. 1.
Transcriptional profiling of Drosophila immune response. a Timeline of 21 time points, including un-infected un-injected sample as control at time 0. Sampling was denser in the first 24 h and continued — although more sparsely — until day 5 (120 h). b Principal component analysis (PCA) of the top 500 genes with highest row variance across all time points shows a coordinated change of gene expression over 5 days. Both replicates are shown for all samples except for the time point at 3 h, where one replicate was excluded from the analysis during RNA-seq data processing. The two samples in blue clustering in the middle (marked with grey dashed circle) correspond to the control time point (0 h). All other time points from 1 to 120 h show a horseshoe temporal pattern around the controls

