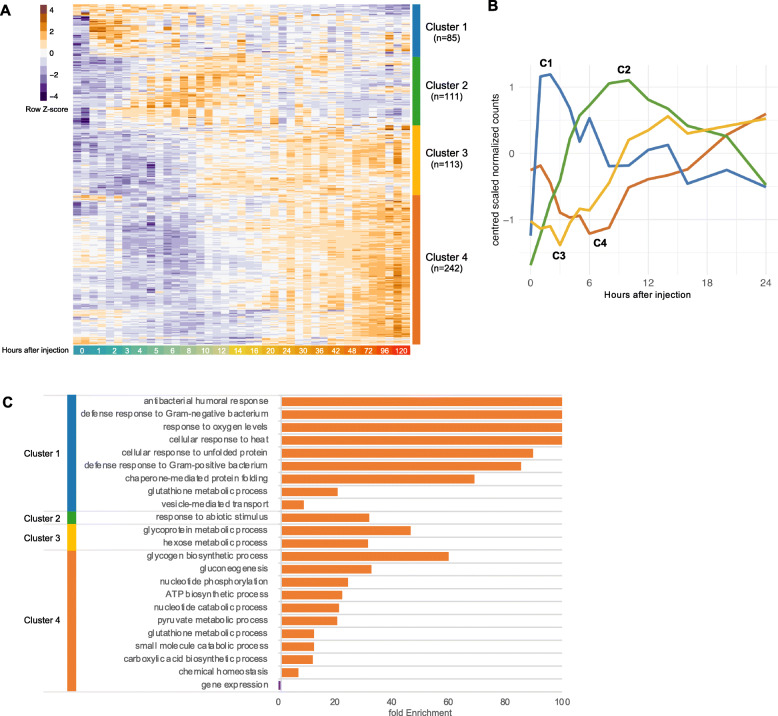
Fig. 5.
Global dynamics of time-dependent genes show divergent patterns of expression. a Heatmap of the 551 most predominant time-dependent genes, identified by spline modeling over 48 and 8 h (FDR < 0.05) and pairwise differential expression (with |log2FC| > 1 and FDR < 0.05). Hierarchical clustering of the genes shows four main clusters characterized by time points in which the genes reach maximum and minimum expression across time. Z-score values of each gene are shown from dark purple (minimum expression across time) to dark orange (maximum expression across time). b Mean patterns of expression across time for genes within each of the four main clusters during the first 24 h, displayed by their centered and scaled normalized counts. c Significant Gene Ontology terms (FDR < 0.05) for over-represented Biological Processes at each cluster

