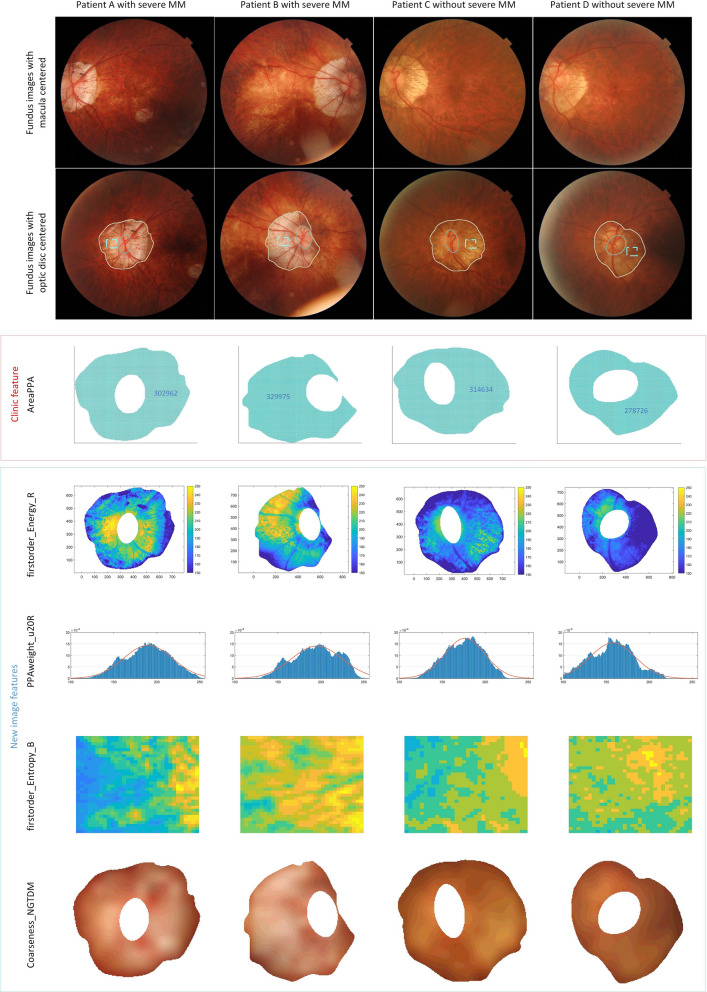
Fig. 6.
Visualization of new image features and clinic proposed features. Column 1 and 2: fundus images of two patients with severe MM. Column 3 and 4: fundus images of two patients without severe MM. The first row: the macula-centered fundus images. The second row: the corresponding optic disc-centered fundus images. The third row: AreaPPA (PPA areas. We chose patients with similar PPA areas as examples, only by counting areas could not distinguish if a patient had severe MM or not). The fourth row: firstorder_Energy_B (energy of PPA). Higher values of firstorder_Energy_B meant brighter intensity in PPA region. The fifth row: PPAweight_u20R (pixel distribution of PPA). Higher average values of PPAweight_u20R meant more rapid fluctuation of pixel values along broadwise direction of PPA region. The sixth row: firstorder_Entropy_B (entropy of PPA). Higher value of firstorder_Entropy_B meant more complexity pixel values distribution in PPA region (zoomed from the rectangular in row 2rd fundus images). The seventh row: Coarseness_NGTDM (Coarseness of PPA). Higher Coarseness_NGTDM values meant a lower spatial change rate and a locally less nonuniform texture

