Figure 1.

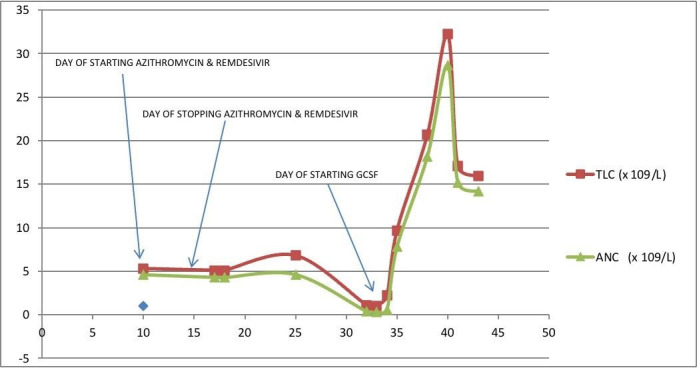
Graph showing trend of total leucocyte count (TLC) and absolute neutrophil count (ANC) with x-axis representing days of illness and y-axis representing values of TLC and ANC in terms of 109/litre.

Graph showing trend of total leucocyte count (TLC) and absolute neutrophil count (ANC) with x-axis representing days of illness and y-axis representing values of TLC and ANC in terms of 109/litre.